Monitoring
etcd monitoring dashboards, metrics, and alert rules.
Dashboards
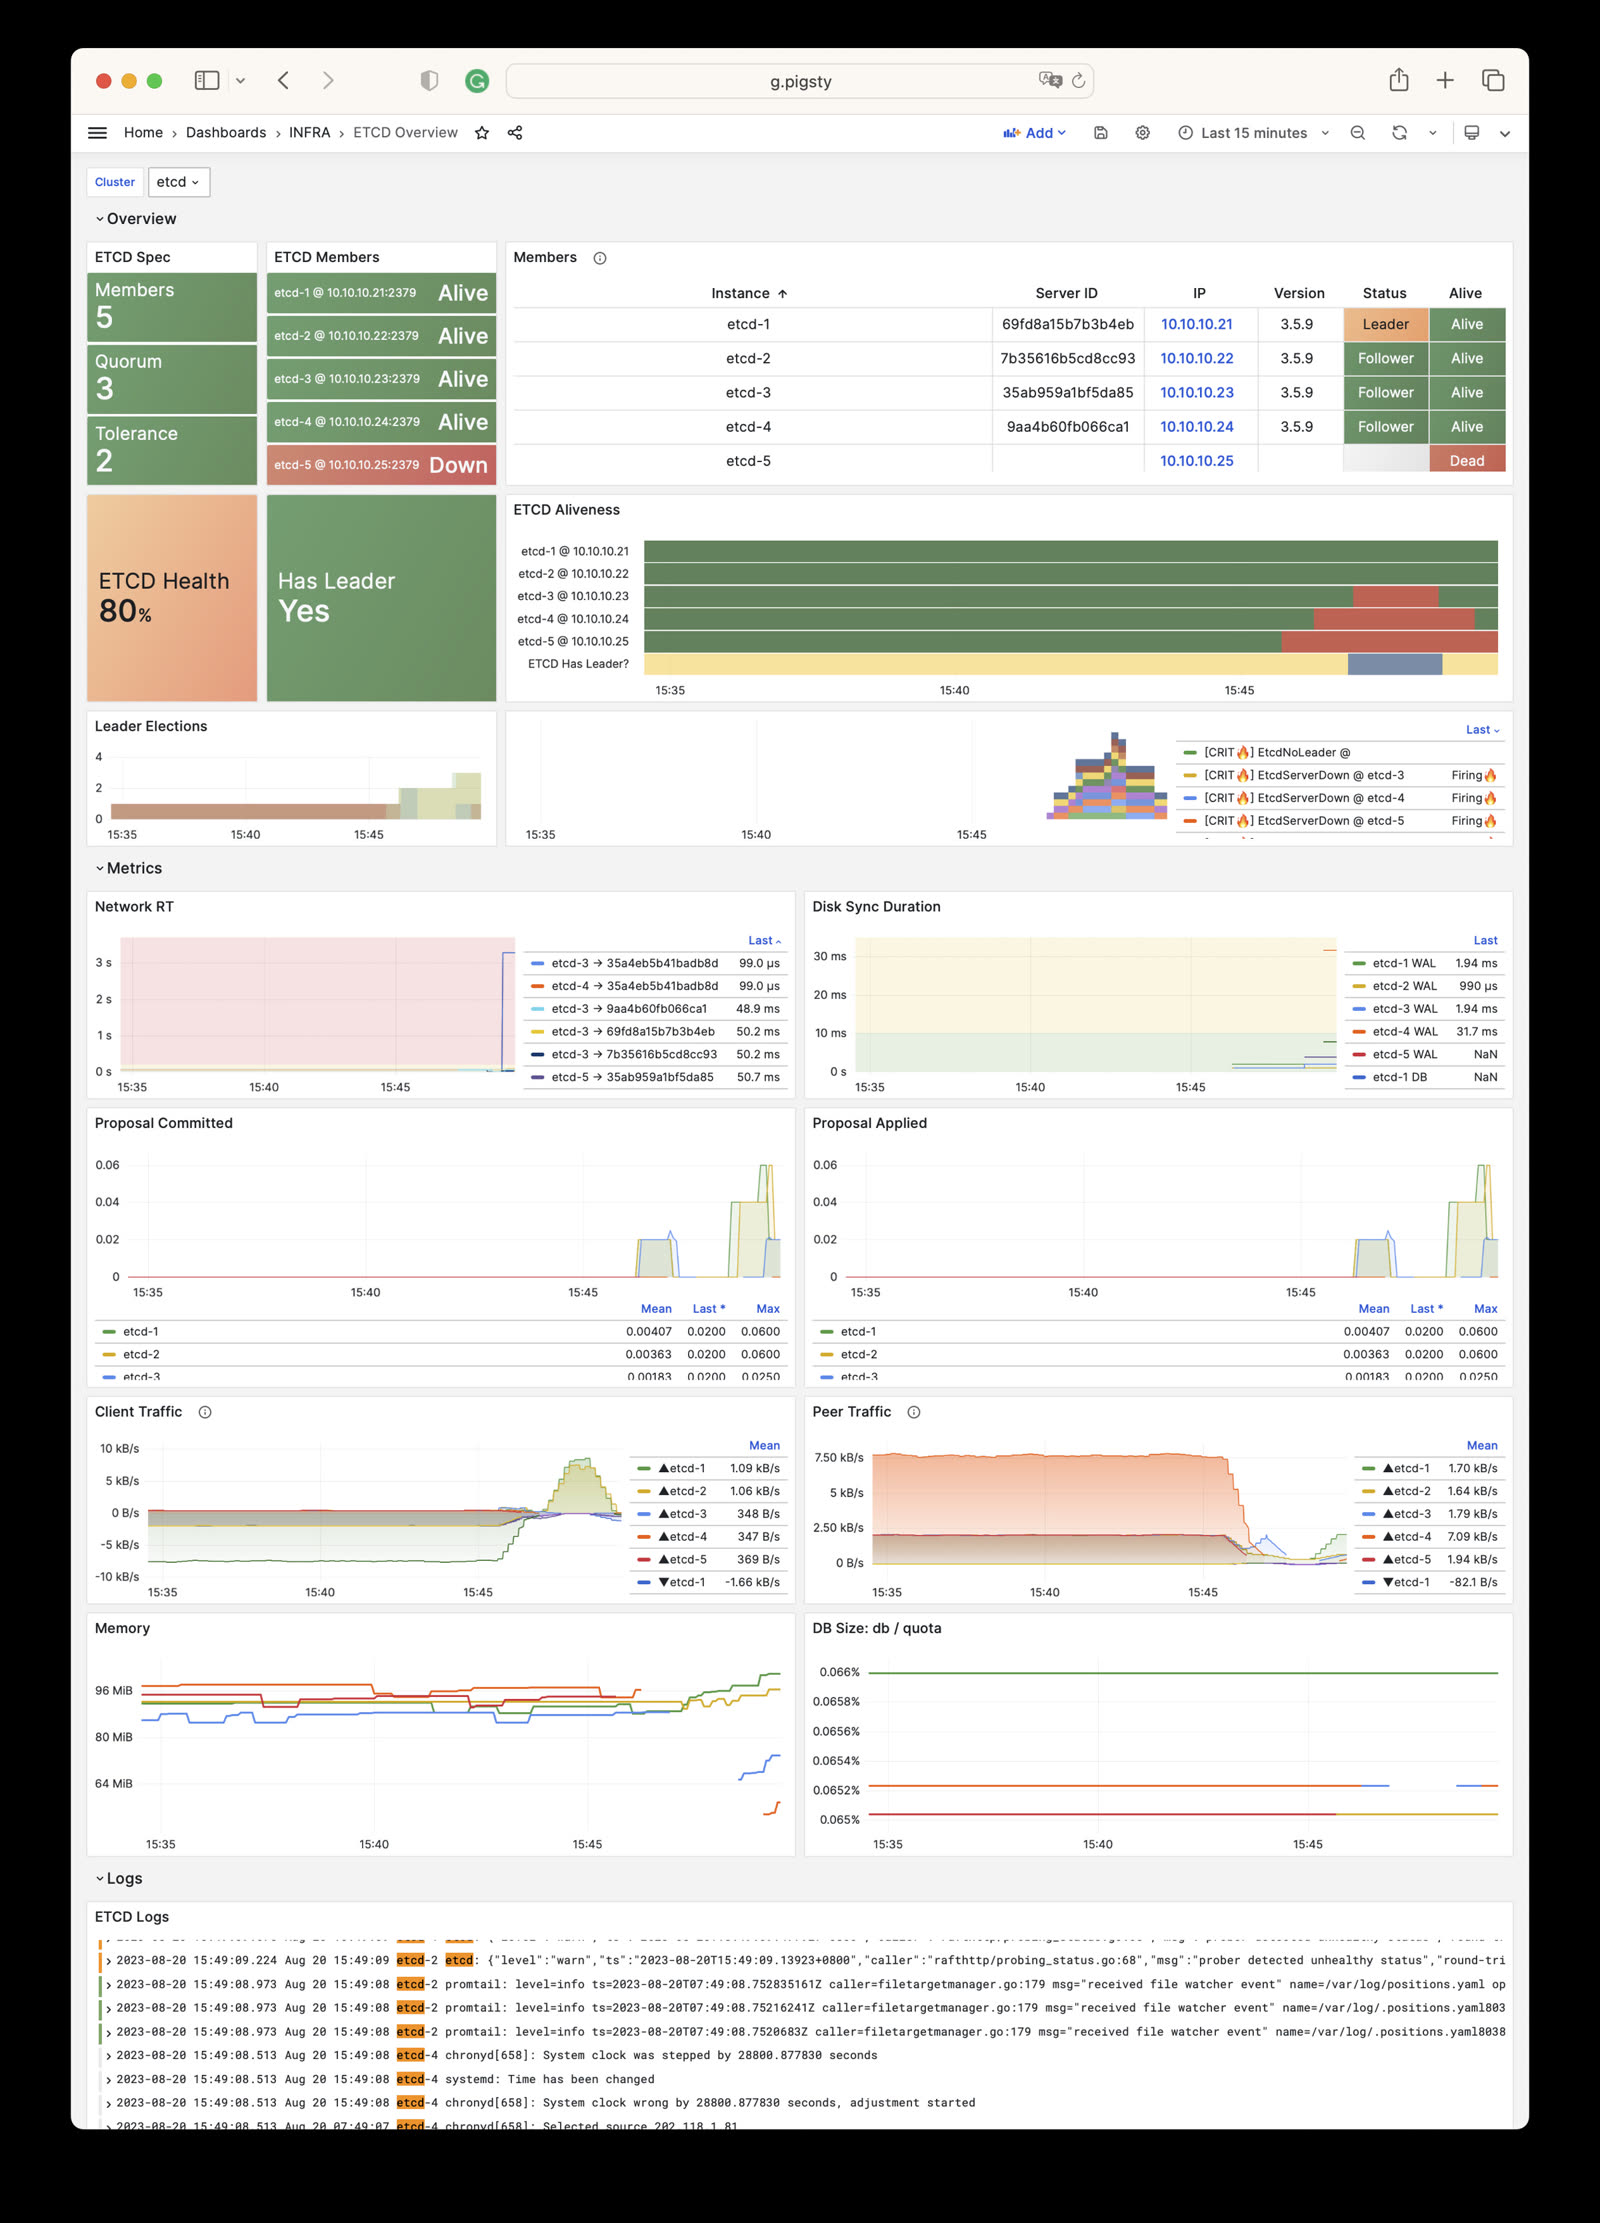
ETCD module provides one monitoring dashboard: Etcd Overview.
ETCD Overview Dashboard
ETCD Overview : Overview of ETCD cluster
Dashboard provides key ETCD status info. Notable: ETCD Aliveness—shows overall etcd cluster service status.
Red bands = instance downtime; blue-gray below = cluster unavailable.
Alert Rules
Pigsty provides five preset alert rules for etcd, defined in files/victoria/rules/etcd.yml
EtcdServerDown: etcd node down, CRIT alertEtcdNoLeader: etcd cluster no leader, CRIT alertEtcdQuotaFull: etcd quota > 90%, WARN alertEtcdNetworkPeerRTSlow: etcd network latency slow, INFO alertEtcdWalFsyncSlow: etcd disk fsync slow, INFO alert
The following excerpt mirrors the current rule source. Pigsty currently ships only the etcd-overview dashboard; the /ui/d/etcd-instance targets in the comments for the two latency alerts do not exist. Use /ui/d/etcd-overview to inspect cluster state. This is a known source-comment discrepancy and does not affect the alert expressions.
#==============================================================#
# Aliveness #
#==============================================================#
# etcd server instance down
- alert : EtcdServerDown
expr : etcd_up < 1
for : 1m
labels : { level : 0, severity : CRIT, category : etcd }
annotations :
summary : "CRIT EtcdServerDown {{ $labels.ins }}@{{ $labels.instance }}"
description : |
etcd_up[ins={{ $labels.ins }}, instance={{ $labels.instance }}] = {{ $value }} < 1
https://demo.pigsty.io/d/etcd-overview
#==============================================================#
# Error #
#==============================================================#
# Etcd no Leader triggers P0 alert immediately
# if dcs_failsafe mode not enabled, may cause global outage
- alert : EtcdNoLeader
expr : min(etcd_server_has_leader) by (cls) < 1
for : 15s
labels : { level : 0, severity : CRIT, category : etcd }
annotations :
summary : "CRIT EtcdNoLeader: {{ $labels.cls }} {{ $value }}"
description : |
etcd_server_has_leader[cls={{ $labels.cls }}] = {{ $value }} < 1
https://demo.pigsty.io/d/etcd-overview?from=now-5m&to=now&var-cls={{$labels.cls}}
#==============================================================#
# Saturation #
#==============================================================#
- alert : EtcdQuotaFull
expr : etcd:cls:quota_usage > 0.90
for : 1m
labels : { level : 1, severity : WARN, category : etcd }
annotations :
summary : "WARN EtcdQuotaFull: {{ $labels.cls }}"
description : |
etcd:cls:quota_usage[cls={{ $labels.cls }}] = {{ $value | printf "%.3f" }} > 90%
https://demo.pigsty.io/d/etcd-overview
#==============================================================#
# Latency #
#==============================================================#
# etcd network peer rt p95 > 200ms for 1m
- alert : EtcdNetworkPeerRTSlow
expr : etcd:ins:network_peer_rt_p95_5m > 0.200
for : 1m
labels : { level : 2, severity : INFO, category : etcd }
annotations :
summary : "INFO EtcdNetworkPeerRTSlow: {{ $labels.cls }} {{ $labels.ins }}"
description : |
etcd:ins:network_peer_rt_p95_5m[cls={{ $labels.cls }}, ins={{ $labels.ins }}] = {{ $value }} > 200ms
https://demo.pigsty.io/d/etcd-instance?from=now-10m&to=now&var-cls={{ $labels.cls }}
# Etcd wal fsync rt p95 > 50ms
- alert : EtcdWalFsyncSlow
expr : etcd:ins:wal_fsync_rt_p95_5m > 0.050
for : 1m
labels : { level : 2, severity : INFO, category : etcd }
annotations :
summary : "INFO EtcdWalFsyncSlow: {{ $labels.cls }} {{ $labels.ins }}"
description : |
etcd:ins:wal_fsync_rt_p95_5m[cls={{ $labels.cls }}, ins={{ $labels.ins }}] = {{ $value }} > 50ms
https://demo.pigsty.io/d/etcd-instance?from=now-10m&to=now&var-cls={{ $labels.cls }}