This is the multi-page printable view of this section. .
Architecture
- 1: Nodes
- 2: Infrastructure
- 3: PGSQL Arch
Pigsty uses a modular architecture with a declarative interface. You can freely combine modules like building blocks as needed.
- Pigsty adopts a modular design that can be freely combined and used on demand (use one or all) to suit different scenarios.
- Pigsty uses config inventory and config parameters to describe the entire deployment environment, implemented via Ansible playbooks.
- Pigsty can run on any node—physical or virtual—as long as the OS is compatible.
Modules
Pigsty uses a modular design with six main default modules: PGSQL, INFRA, NODE, ETCD, REDIS, and MINIO.
PGSQL: Self-healing HA Postgres clusters powered by Patroni, Pgbouncer, HAproxy, PgBackrest, and more.INFRA: Local software repo, Nginx, Grafana, Victoria, AlertManager, Blackbox Exporter—the complete observability stack.NODE: Tune nodes to desired state—hostname, timezone, NTP, ssh, sudo, haproxy, docker, vector, keepalived.ETCD: Distributed key-value store as DCS for HA Postgres clusters: consensus leader election/config management/service discovery.REDIS: Redis servers supporting standalone primary-replica, sentinel, and cluster modes with full monitoring.MINIO: S3-compatible simple object storage that can serve as an optional backup destination for PG databases.
You can declaratively compose them freely. If you only want host monitoring, installing the INFRA module on infrastructure nodes and the NODE module on managed nodes is sufficient.
The ETCD and PGSQL modules are used to build HA PG clusters—installing these modules on multiple nodes automatically forms a high-availability database cluster.
You can reuse Pigsty infrastructure and develop your own modules; REDIS and MINIO can serve as examples. Protocol compatibility layers such as PostgreSQL Mongo mode are composed from standard PGSQL and Docker APP workflows.
Note that all modules depend strongly on the NODE module: in Pigsty, nodes must first have the NODE module installed to be managed before deploying other modules.
When nodes (by default) use the local software repo for installation, the NODE module has a weak dependency on the INFRA module. Therefore, the admin/infrastructure nodes with the INFRA module complete the bootstrap process in the deploy.yml playbook, resolving the circular dependency.
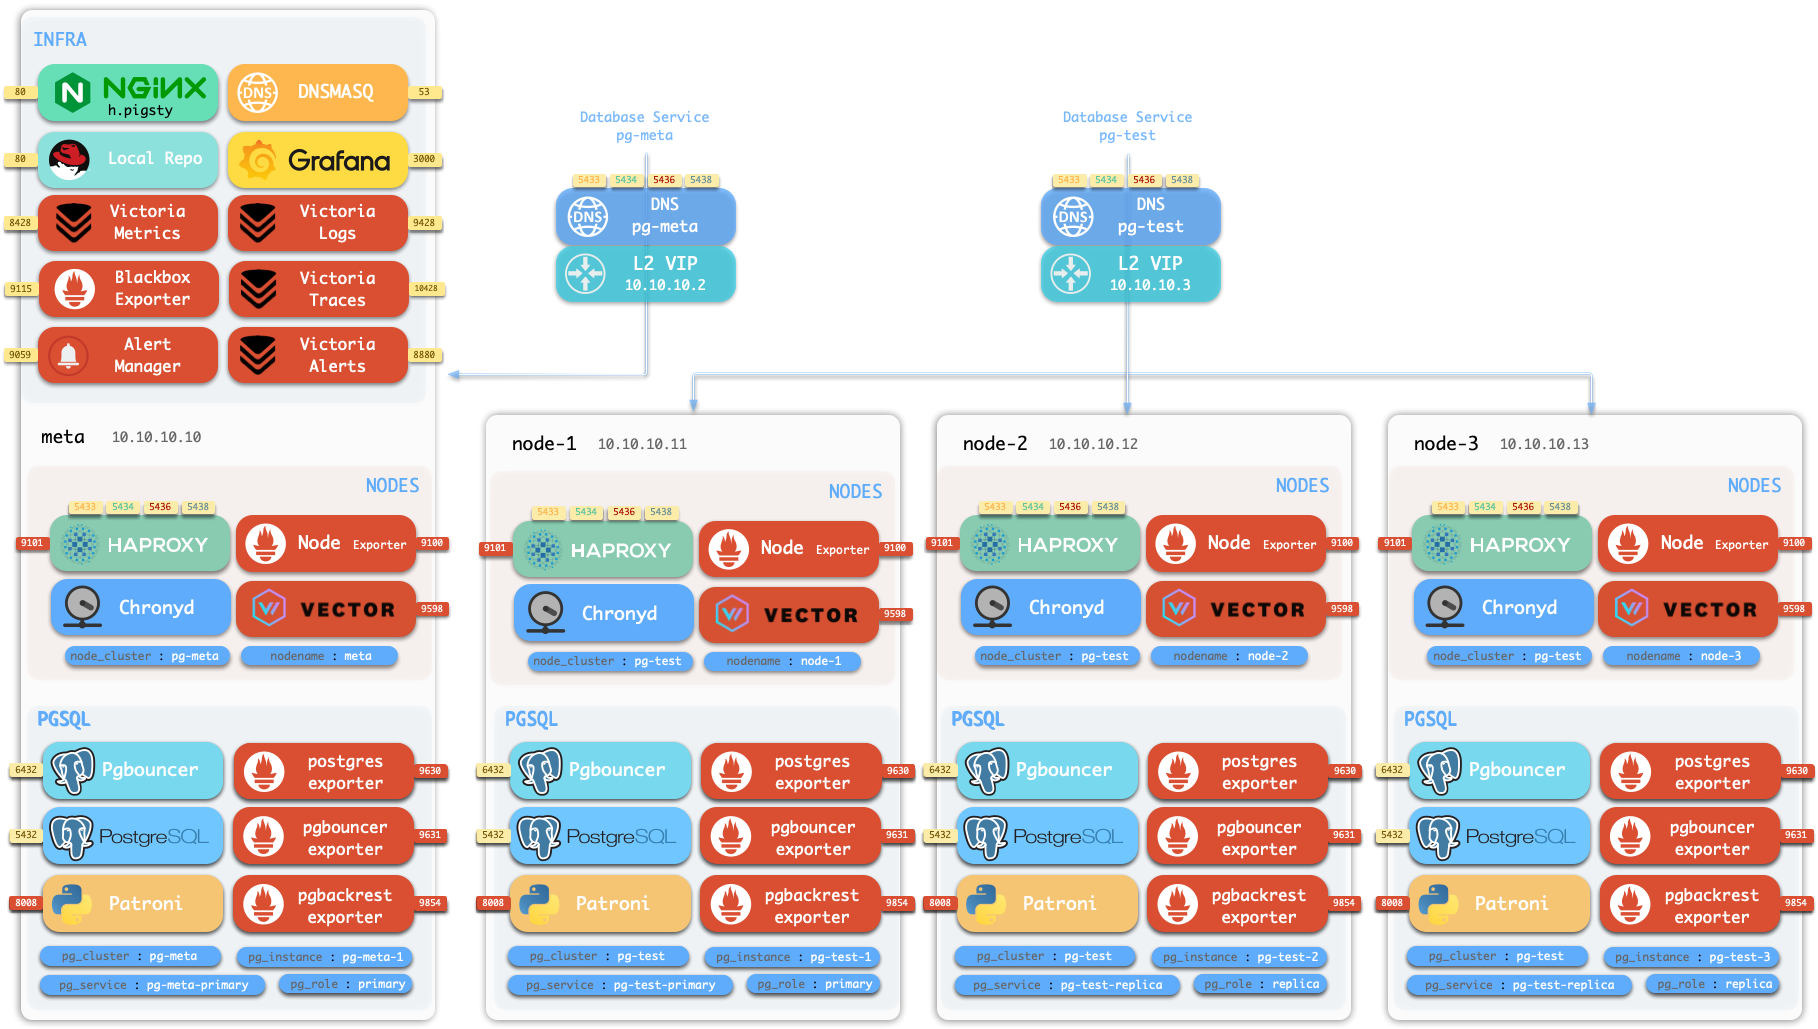
Standalone Installation
By default, Pigsty installs on a single node (physical/virtual machine). The deploy.yml playbook installs INFRA, ETCD, PGSQL, and optionally MINIO modules on the current node,
giving you a fully-featured observability stack (VictoriaMetrics, VictoriaLogs, VictoriaTraces, Grafana, Alertmanager, Blackbox Exporter, etc.), plus a built-in PostgreSQL standalone instance as a CMDB, ready to use out of the box (cluster name pg-meta, database name meta).
This node now has a complete self-monitoring system, visualization tools, and a Postgres database with PITR auto-configured (HA unavailable since you only have one node). You can use this node as a devbox, for testing, running demos, and data visualization/analysis. Or, use this node as an admin node to deploy and manage more nodes!
Monitoring
The installed standalone meta node can serve as an admin node and monitoring center to bring more nodes and database servers under its supervision and control.
Pigsty’s monitoring system can be used independently. If you want to install the VictoriaMetrics/Grafana observability stack, Pigsty provides best practices! It offers rich dashboards for host nodes and PostgreSQL databases. Whether or not these nodes or PostgreSQL servers are managed by Pigsty, with simple configuration, you immediately have a production-grade monitoring and alerting system, bringing existing hosts and PostgreSQL under management.

HA PostgreSQL Clusters
Pigsty helps you own your own production-grade HA PostgreSQL RDS service anywhere.
To create such an HA PostgreSQL cluster/RDS service, you simply describe it with a short config and run the playbook to create it:
In less than 10 minutes, you’ll have a PostgreSQL database cluster with service access, monitoring, backup PITR, and HA fully configured.
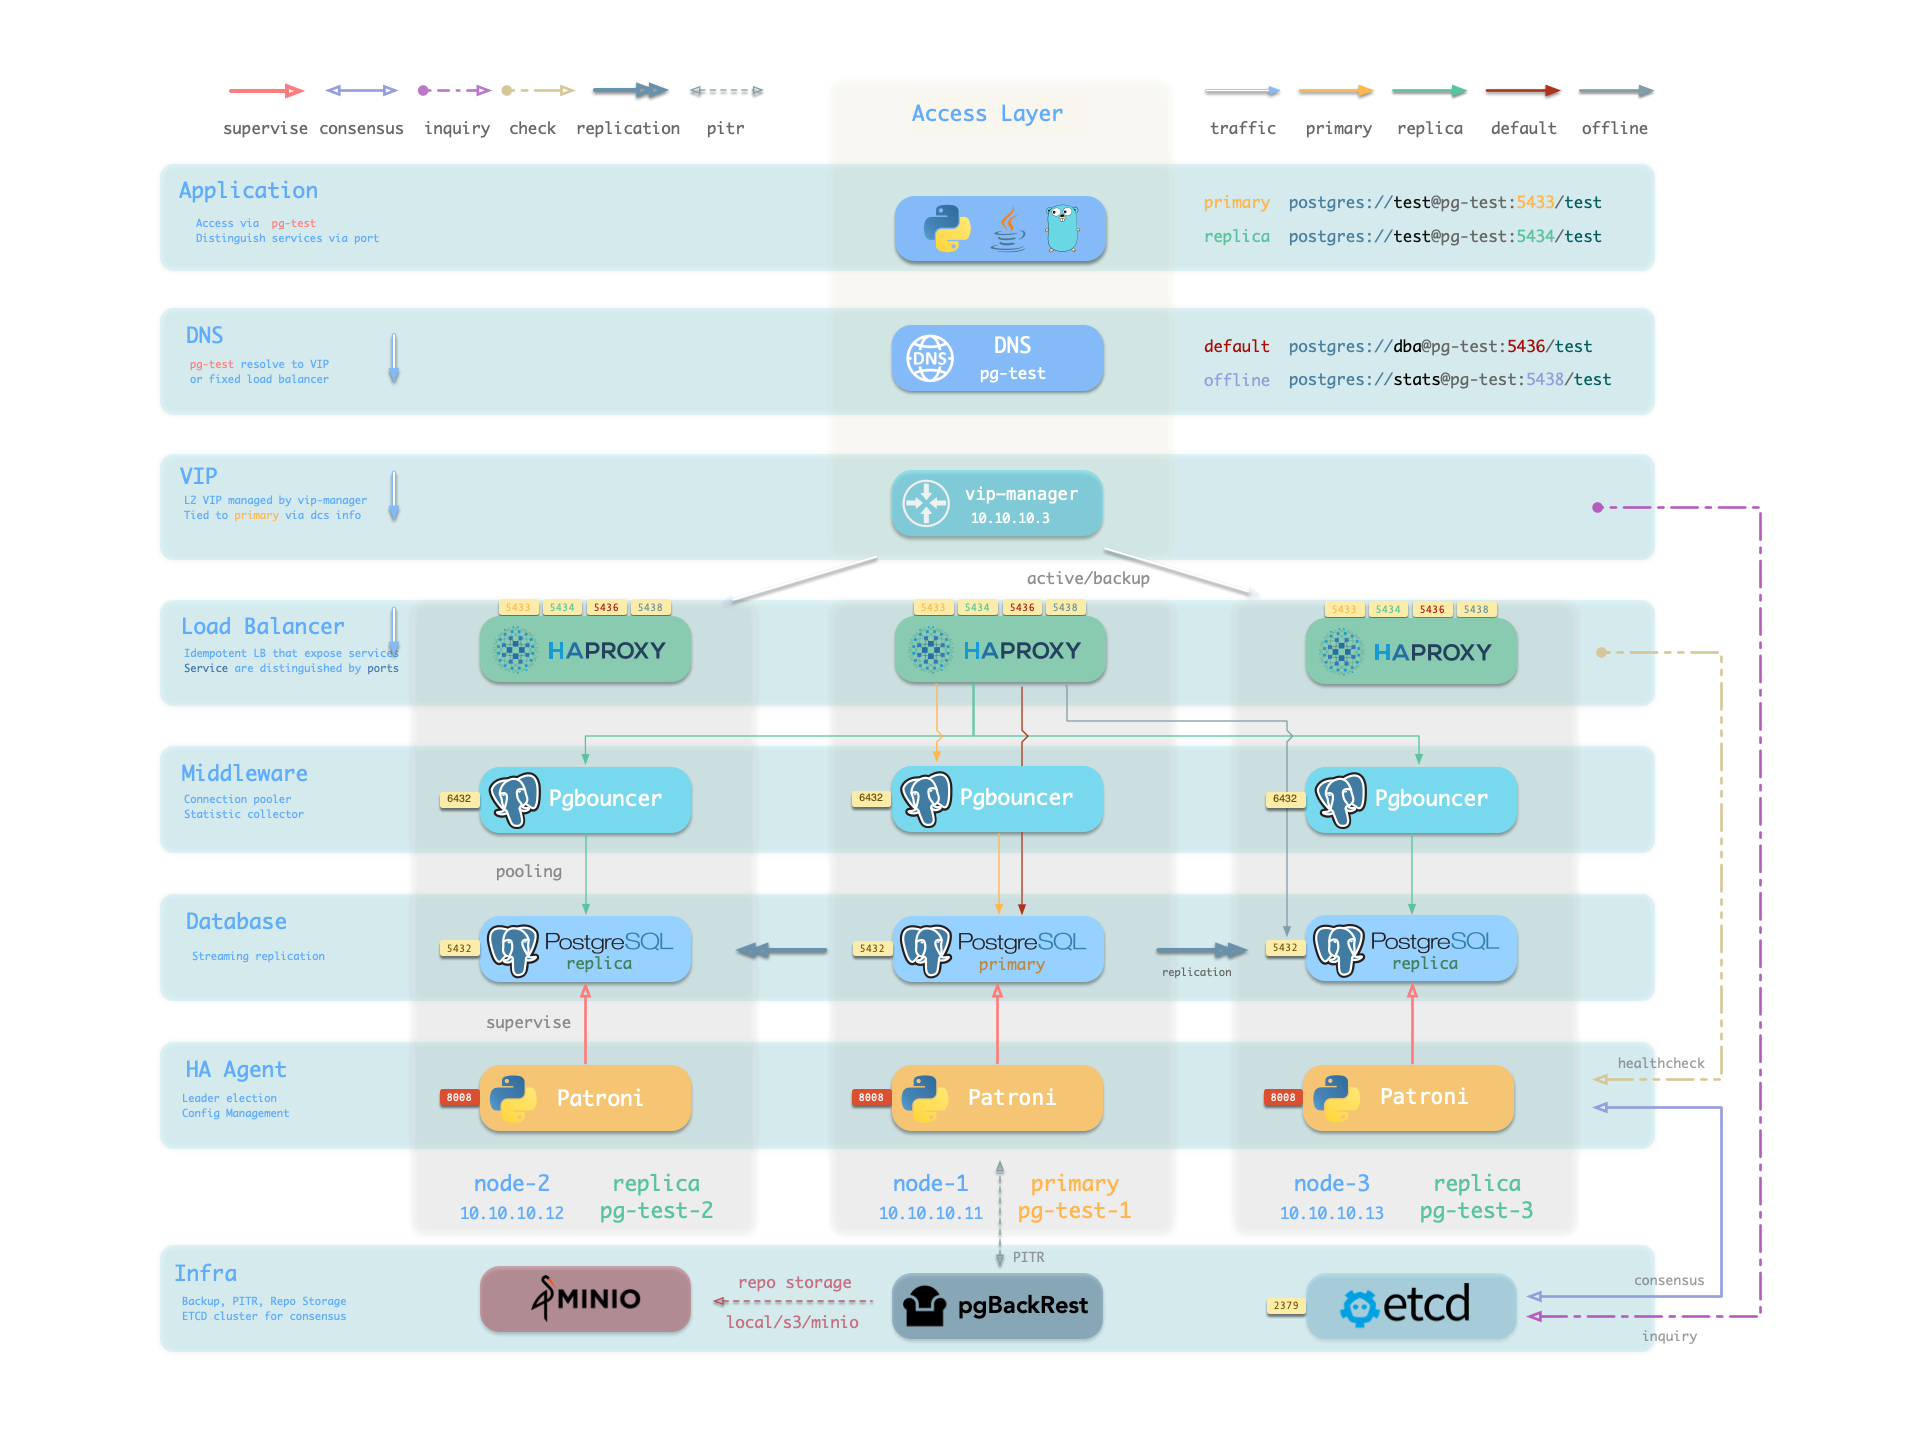
Hardware failures are covered by the self-healing HA architecture provided by patroni, etcd, and haproxy—in case of primary failure, automatic failover executes within 45 seconds by default. Clients don’t need to modify config or restart applications: Haproxy uses patroni health checks for traffic distribution, and read-write requests are automatically routed to the new cluster primary, avoiding split-brain issues. This process is seamless—for example, in case of replica failure or planned switchover, clients experience only a momentary flash of the current query.
Software failures, human errors, and datacenter-level disasters are covered by pgBackRest and the optional Silo cluster. This provides local/cloud PITR capabilities and, in case of datacenter failure, offers cross-region replication and disaster recovery.
1 - Nodes
A node is an abstraction of hardware resources and operating systems. It can be a physical machine, bare metal, virtual machine, or container/pod.
Any machine running a Linux OS (with systemd daemon) and standard CPU/memory/disk/network resources can be treated as a node.
Nodes can have modules installed. Pigsty has several node types, distinguished by which modules are deployed:
| Type | Description |
|---|---|
| Regular Node | A node managed by Pigsty |
| ADMIN Node | The node that runs Ansible to issue management commands |
| INFRA Node | Nodes with the INFRA module installed |
| ETCD Node | Nodes with the ETCD module for DCS |
| MINIO Node | Nodes with the MINIO module for object storage |
| PGSQL Node | Nodes with the PGSQL module installed |
| … | Nodes with other modules… |
In a singleton Pigsty deployment, multiple roles converge on one node: it serves as the regular node, admin node, infra node, ETCD node, and database node simultaneously.
Regular Node
Nodes managed by Pigsty can have modules installed. The node.yml playbook configures nodes to the desired state.
A regular node may run the following services:
| Component | Port | Description | Status |
|---|---|---|---|
node_exporter |
9100 |
Host metrics exporter | Enabled |
haproxy |
9101 |
HAProxy load balancer (admin port) | Enabled |
vector |
9598 |
Log collection agent | Enabled |
docker |
9323 |
Container runtime support | Optional |
keepalived |
n/a |
L2 VIP for node cluster | Optional |
keepalived_exporter |
9650 |
Keepalived status monitor | Optional |
Here, node_exporter exposes host metrics, vector sends logs to the collection system, and haproxy provides load balancing. These three are enabled by default.
Docker, keepalived, and keepalived_exporter are optional and can be enabled as needed.
ADMIN Node
A Pigsty deployment has exactly one admin node—the node that runs Ansible playbooks and issues control/deployment commands.
This node has ssh/sudo access to all other nodes. Admin node security is critical and access must be strictly controlled; see Security Model: Trust Boundaries for its trust scope and critical assets.
During single-node installation and configuration, the current node becomes the admin node. However, alternatives exist. For example, if your laptop can SSH to all managed nodes and has Ansible installed, it can serve as the admin node—though this isn’t recommended for production.
For instance, you might use your laptop to manage a Pigsty VM in the cloud. In this case, your laptop is the admin node.
In serious production environments, the admin node is typically 1-2 dedicated DBA machines. In resource-constrained setups, INFRA nodes often double as admin nodes since all INFRA nodes have Ansible installed by default.
INFRA Node
A Pigsty deployment may have 1 or more INFRA nodes; large production environments typically have 2-3.
The infra group in the inventory defines which nodes are INFRA nodes. These nodes run the INFRA module with these components:
| Component | Port | Description |
|---|---|---|
nginx |
80/443 |
Web UI, local software repository |
grafana |
3000 |
Visualization platform |
victoriaMetrics |
8428 |
Time-series database (metrics) |
victoriaLogs |
9428 |
Log collection server |
victoriaTraces |
10428 |
Trace collection server |
vmalert |
8880 |
Alerting and derived metrics |
alertmanager |
9059 |
Alert aggregation and routing |
blackbox_exporter |
9115 |
Blackbox probing (ping nodes/VIPs) |
dnsmasq |
53 |
Internal DNS resolution |
chronyd |
123 |
NTP time server |
ansible |
- |
Playbook execution |
Nginx serves as the module’s entry point, providing the web UI and local software repository. With multiple INFRA nodes, services on each are independent, but you can access all monitoring data sources from any INFRA node’s Grafana.
Pigsty is licensed under Apache-2.0, though embedded Grafana component uses AGPLv3.
ETCD Node
The ETCD module provides Distributed Consensus Service (DCS) for PostgreSQL high availability.
The etcd group in the inventory defines ETCD nodes. These nodes run etcd servers on two ports:
| Component | Port | Description |
|---|---|---|
etcd |
2379 |
ETCD key-value store (client port) |
etcd |
2380 |
ETCD cluster peer communication |
MINIO Node
The MINIO module provides optional backup storage for PostgreSQL.
The minio inventory group defines MINIO module nodes. In v4.5.0, these nodes run Silo servers on:
| Component | Port | Description |
|---|---|---|
silo |
9000 |
S3 API endpoint |
silo |
9001 |
Silo admin console |
PGSQL Node
Nodes with the PGSQL module are called PGSQL nodes. Node and PostgreSQL instance have a 1:1 deployment—one PG instance per node.
PGSQL nodes can borrow identity from their PostgreSQL instance—controlled by node_id_from_pg, defaulting to true, meaning the node name is set to the PG instance name.
PGSQL nodes run these additional components beyond regular node services:
| Component | Port | Description | Status |
|---|---|---|---|
postgres |
5432 |
PostgreSQL database server | Enabled |
pgbouncer |
6432 |
PgBouncer connection pool | Enabled |
patroni |
8008 |
Patroni HA management | Enabled |
pg_exporter |
9630 |
PostgreSQL metrics exporter | Enabled |
pgbouncer_exporter |
9631 |
PgBouncer metrics exporter | Enabled |
pgbackrest_exporter |
9854 |
pgBackRest metrics exporter | Enabled |
vip-manager |
n/a |
Binds L2 VIP to cluster primary | Optional |
{{ pg_cluster }}-primary |
5433 |
HAProxy service: pooled read/write | Enabled |
{{ pg_cluster }}-replica |
5434 |
HAProxy service: pooled read-only | Enabled |
{{ pg_cluster }}-default |
5436 |
HAProxy service: primary direct connection | Enabled |
{{ pg_cluster }}-offline |
5438 |
HAProxy service: offline read | Enabled |
{{ pg_cluster }}-<service> |
543x |
HAProxy service: custom PostgreSQL services | Custom |
The vip-manager is only enabled when users configure a PG VIP.
Additional custom services can be defined in pg_services, exposed via haproxy using additional service ports.
Node Relationships
Regular nodes typically reference an INFRA node via the admin_ip parameter as their infrastructure provider.
For example, with global admin_ip = 10.10.10.10, all nodes use infrastructure services at this IP.
Parameters that reference ${admin_ip}:
| Parameter | Module | Default Value | Description |
|---|---|---|---|
repo_endpoint |
INFRA |
http://${admin_ip}:80 |
Software repo URL |
repo_upstream.baseurl |
INFRA |
http://${admin_ip}/pigsty |
Local repo baseurl |
infra_portal.endpoint |
INFRA |
${admin_ip}:<port> |
Nginx proxy backend |
dns_records |
INFRA |
["${admin_ip} i.pigsty", ...] |
DNS records |
node_default_etc_hosts |
NODE |
["${admin_ip} i.pigsty"] |
Default static DNS |
node_etc_hosts |
NODE |
- | Custom static DNS |
node_dns_servers |
NODE |
["${admin_ip}"] |
Dynamic DNS servers |
node_ntp_servers |
NODE |
- | NTP servers (optional) |
Typically the admin node and INFRA node coincide. With multiple INFRA nodes, the admin node is usually the first one; others serve as backups.
In large-scale production deployments, you might separate the Ansible admin node from INFRA module nodes. For example, use 1-2 small dedicated hosts under the DBA team as the control hub (ADMIN nodes), and 2-3 high-spec physical machines as monitoring infrastructure (INFRA nodes).
Typical node counts by deployment scale:
| Scale | ADMIN | INFRA | ETCD | MINIO | PGSQL |
|---|---|---|---|---|---|
| Single-node | 1 | 1 | 1 | 0 | 1 |
| 3-node | 1 | 3 | 3 | 0 | 3 |
| Small prod | 1 | 2 | 3 | 0 | N |
| Large prod | 2 | 3 | 5 | 4+ | N |
2 - Infrastructure
Running production-grade, highly available PostgreSQL clusters typically requires a comprehensive set of infrastructure services (foundation) for support, such as monitoring and alerting, log collection, time synchronization, DNS resolution, and local software repositories. Pigsty provides the INFRA module to address this—it’s an optional module, but we strongly recommend enabling it.
Overview
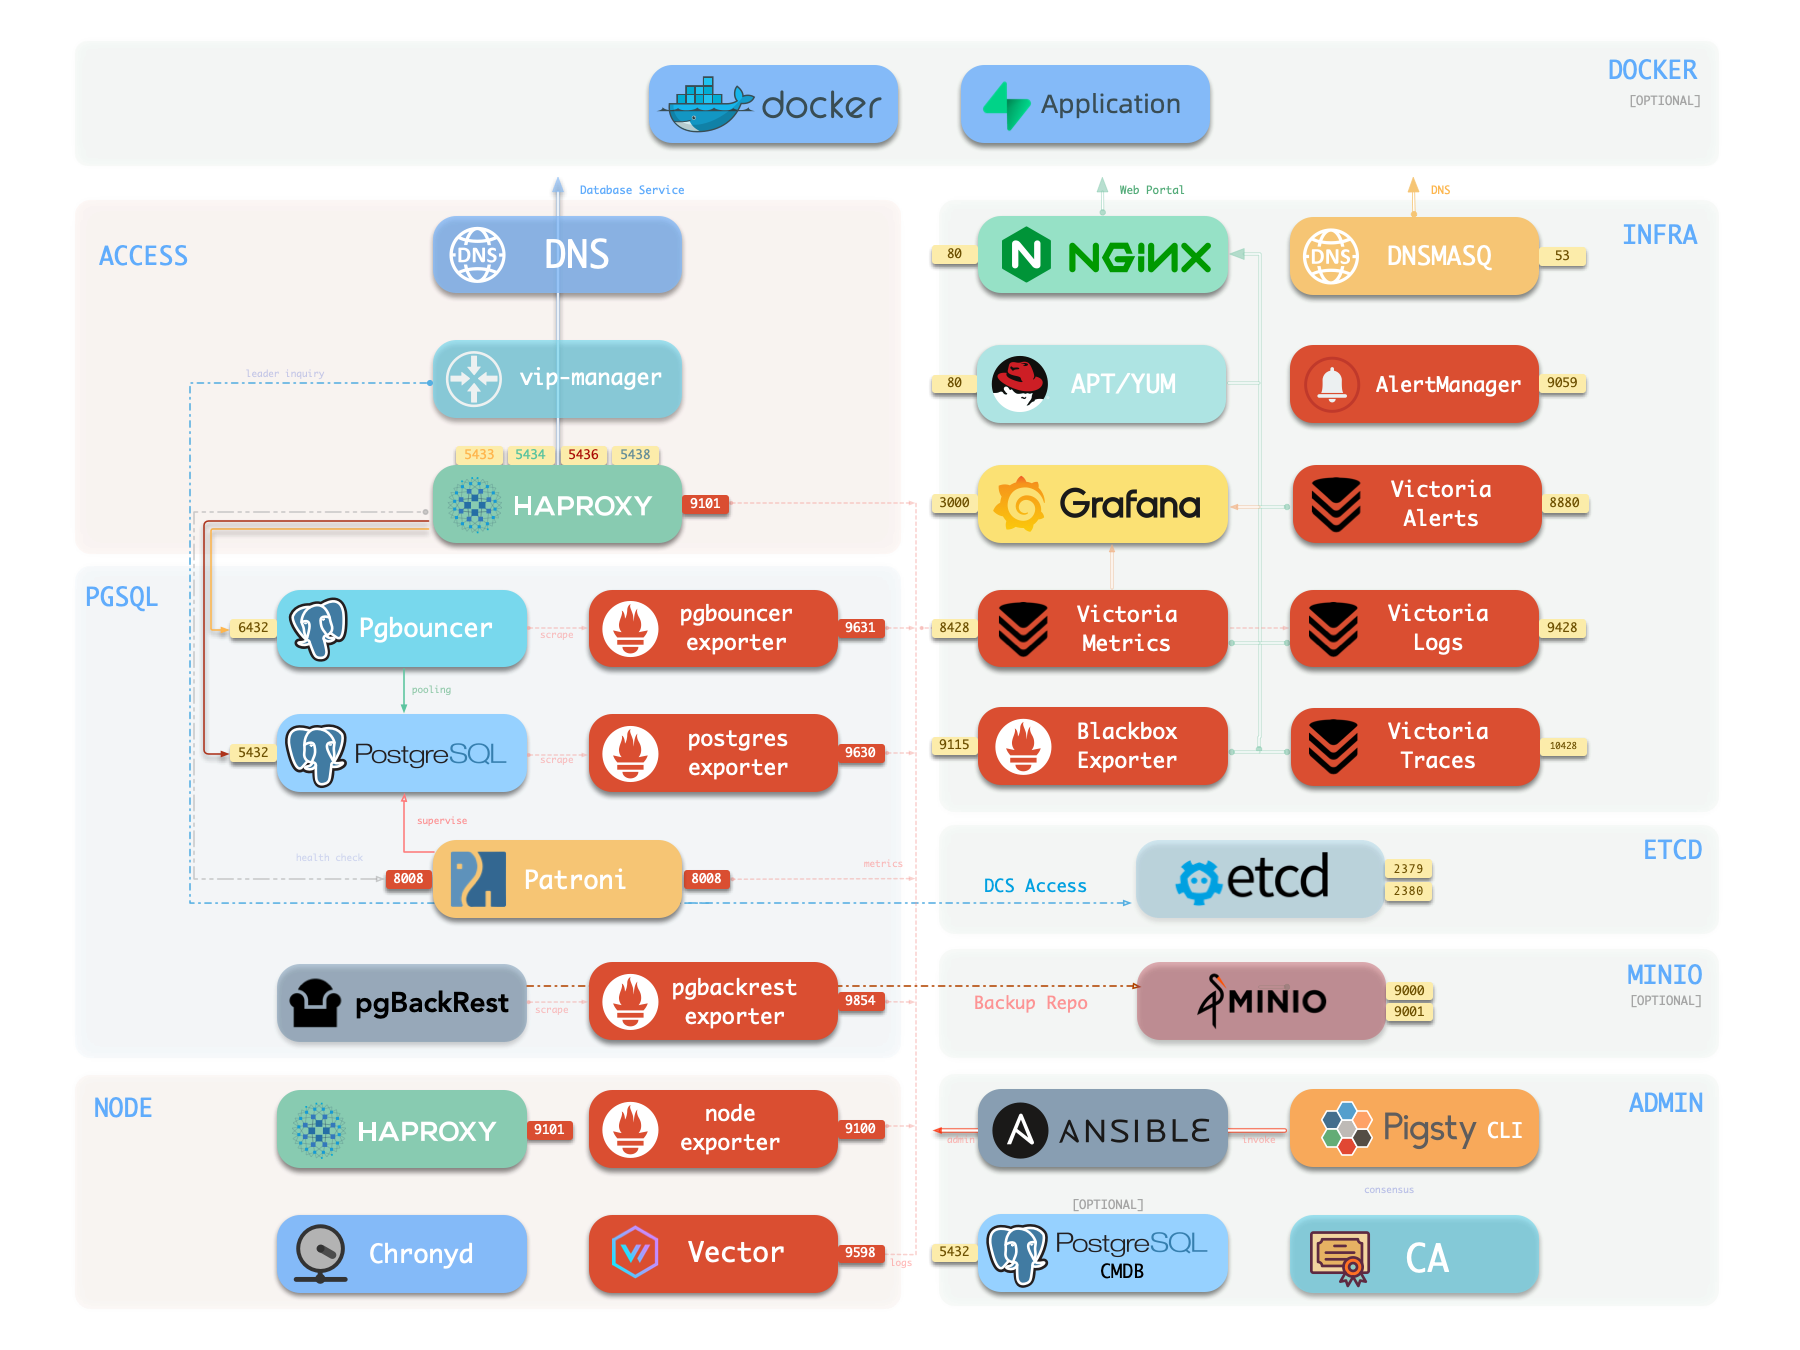
The diagram below shows the architecture of a single-node deployment. The right half represents the components included in the INFRA module:
| Component | Type | Description |
|---|---|---|
| Nginx | Web Server | Unified entry for WebUI, local repo, reverse proxy for internal services |
| Repo | Software Repo | APT/DNF repository with all RPM/DEB packages needed for deployment |
| Grafana | Visualization | Displays metrics, logs, and traces; hosts dashboards, reports, and custom data apps |
| VictoriaMetrics | Time Series DB | Scrapes all metrics, Prometheus API compatible, provides VMUI query interface |
| VictoriaLogs | Log Platform | Centralized log storage; all nodes run Vector by default, pushing logs here |
| VictoriaTraces | Tracing | Collects slow SQL, service traces, and other tracing data |
| VMAlert | Eval Rule/Alert | Evaluates alerting rules, pushes events to Alertmanager |
| AlertManager | Alert Manager | Aggregates alerts, dispatches notifications via email, Webhook, etc. |
| BlackboxExporter | Blackbox Probe | Probes reachability of IPs/VIPs/URLs |
| DNSMASQ | DNS Service | Provides DNS resolution for domains used within Pigsty [Optional] |
| Chronyd | Time Sync | Provides NTP time synchronization to ensure consistent time across nodes [Optional] |
| CA | Certificate | Issues encryption certificates within the environment |
| Ansible | Orchestration | Batch, declarative, agentless tool for managing large numbers of servers |
Nginx
Nginx is the access entry point for all WebUI services in Pigsty, using ports 80 / 443 for HTTP/HTTPS by default. Live Demo
| IP Access (replace) | Domain (HTTP) | Domain (HTTPS) | Public Demo |
|---|---|---|---|
http://10.10.10.10 |
http://i.pigsty |
https://i.pigsty |
https://demo.pigsty.io |
Infrastructure components with WebUIs can be exposed uniformly through Nginx, such as Grafana, VictoriaMetrics (VMUI), AlertManager, and HAProxy console. Additionally, the local software repository and other static resources are served via Nginx.
Nginx configures local web servers or reverse proxy servers based on definitions in infra_portal.
By default, it exposes Pigsty’s admin homepage: i.pigsty. Different endpoints on this page proxy different components:
| Endpoint | Component | Native Port | Notes | Public Demo |
|---|---|---|---|---|
/ |
Nginx | 80/443 |
Homepage, local repo, file server | demo.pigsty.io |
/ui/ |
Grafana | 3000 |
Grafana dashboard entry | demo.pigsty.io/ui/ |
/vmetrics/ |
VictoriaMetrics | 8428 |
Time series DB Web UI | demo.pigsty.io/vmetrics/ |
/vlogs/ |
VictoriaLogs | 9428 |
Log DB Web UI | demo.pigsty.io/vlogs/ |
/vtraces/ |
VictoriaTraces | 10428 |
Tracing Web UI | demo.pigsty.io/vtraces/ |
/vmalert/ |
VMAlert | 8880 |
Alert rule management | demo.pigsty.io/vmalert/ |
/alertmgr/ |
AlertManager | 9059 |
Alert management Web UI | demo.pigsty.io/alertmgr/ |
/blackbox/ |
Blackbox | 9115 |
Blackbox probe |
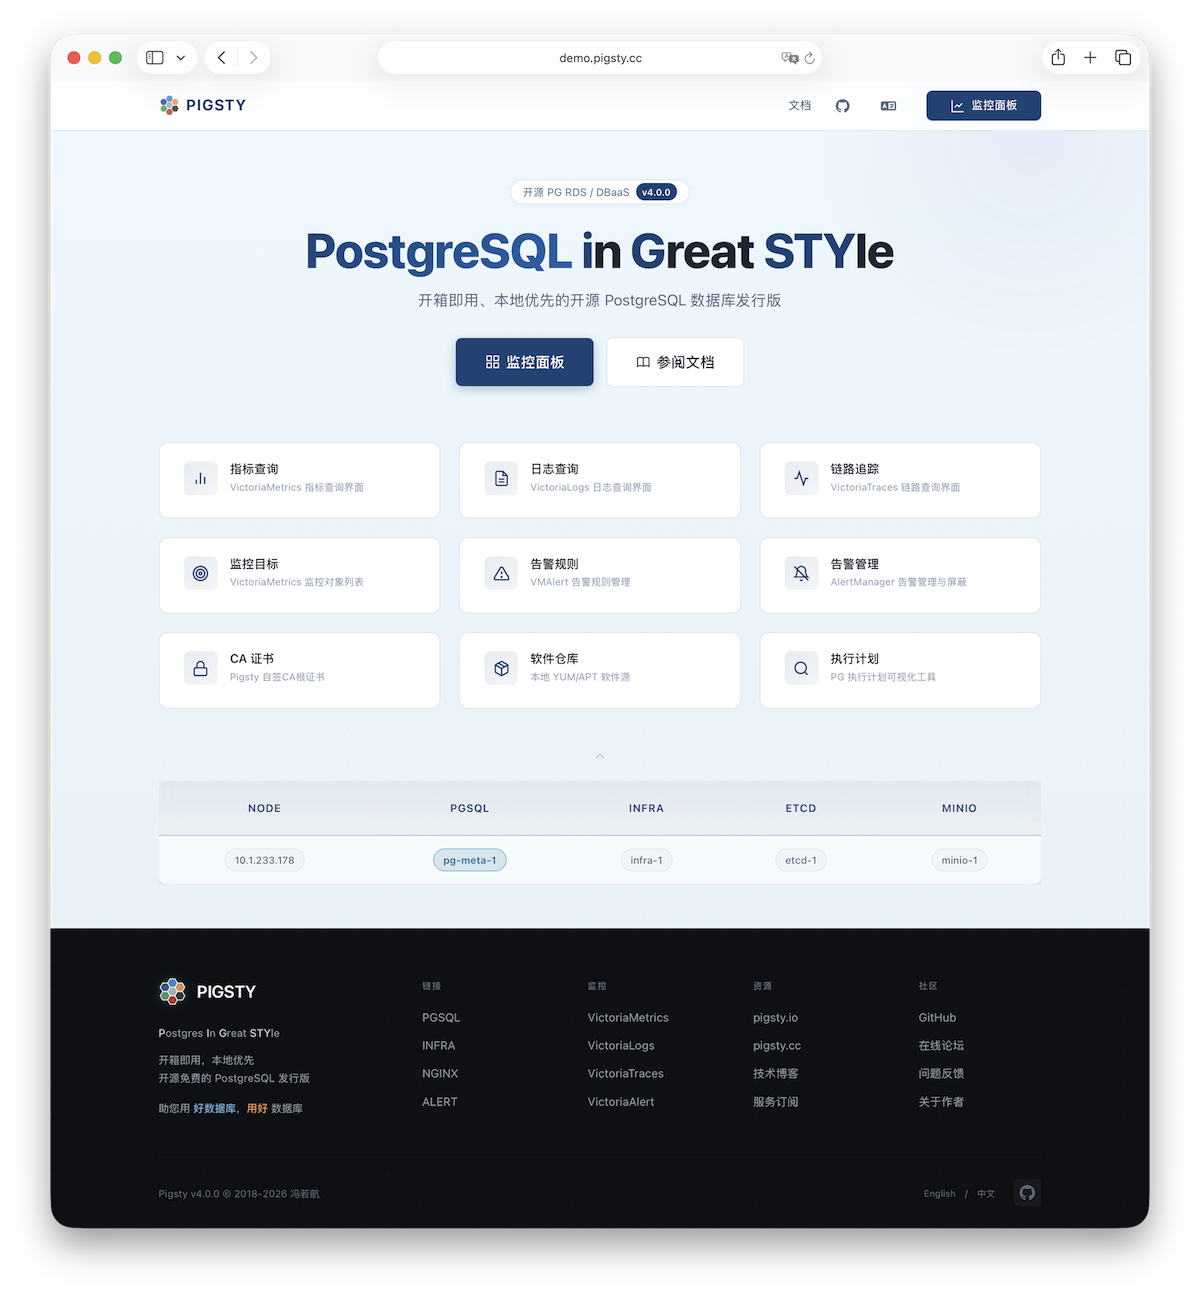
Pigsty allows rich customization of Nginx as a local file server or reverse proxy, with self-signed or real HTTPS certificates.
For more information, see: Tutorial: Nginx—Expose Web Services via Proxy and Tutorial: Certbot—Request and Renew HTTPS Certificates
Repo
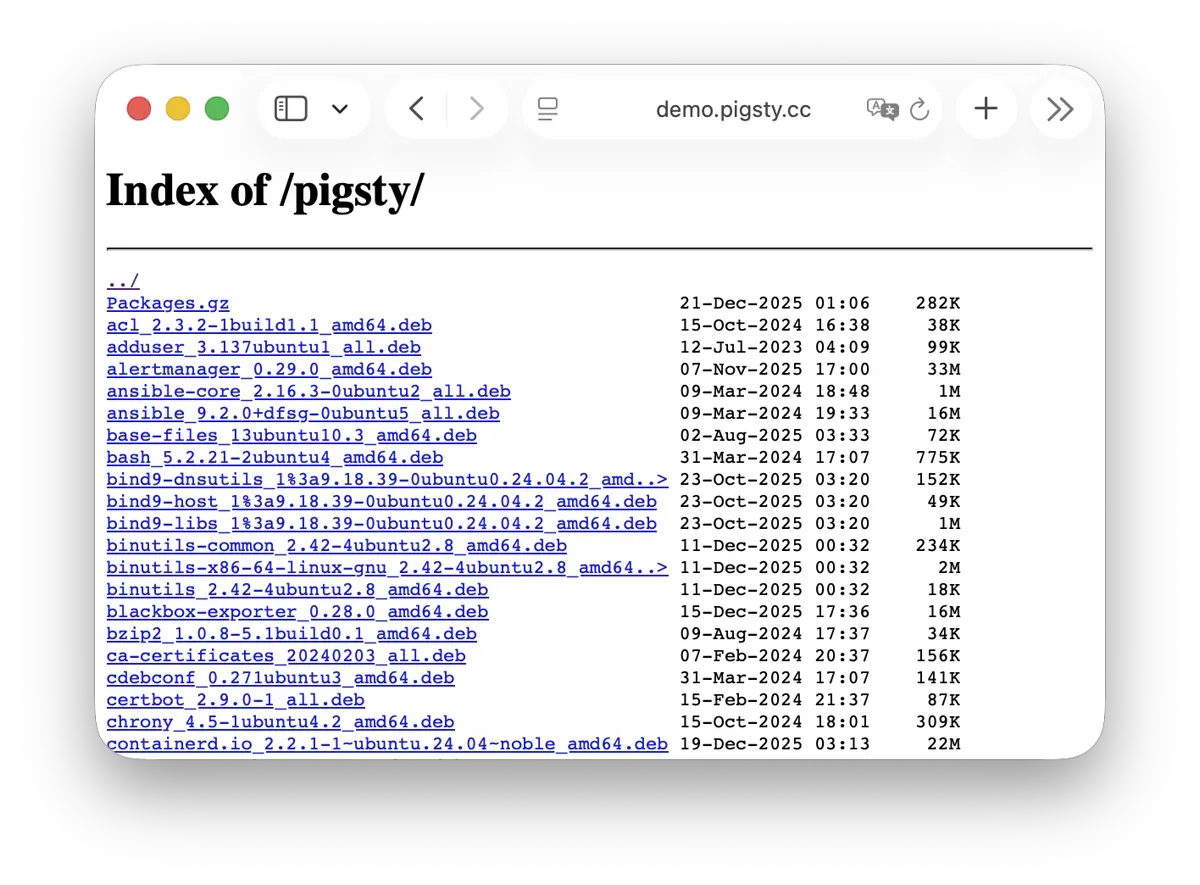
Pigsty creates a local software repository on the Infra node during installation to accelerate subsequent software installations. Live Demo
This repository defaults to the /www/pigsty directory,
served by Nginx and mounted at the /pigsty path:
| IP Access (replace) | Domain (HTTP) | Domain (HTTPS) | Public Demo |
|---|---|---|---|
http://10.10.10.10/pigsty |
http://i.pigsty/pigsty |
https://i.pigsty/pigsty |
https://demo.pigsty.io/pigsty |
Pigsty supports offline installation, which essentially pre-copies a prepared local software repository to the target environment.
When Pigsty finds /www/pigsty/repo_complete during deployment, it skips upstream downloads and uses the existing repository directly.
The current source has sow generate this file as both a completion marker and a SHA-256 manifest of repository contents. To force a rebuild, run ./infra.yml -t repo_build -e repo_build=true.
For more information, see: Config: INFRA - REPO
Grafana
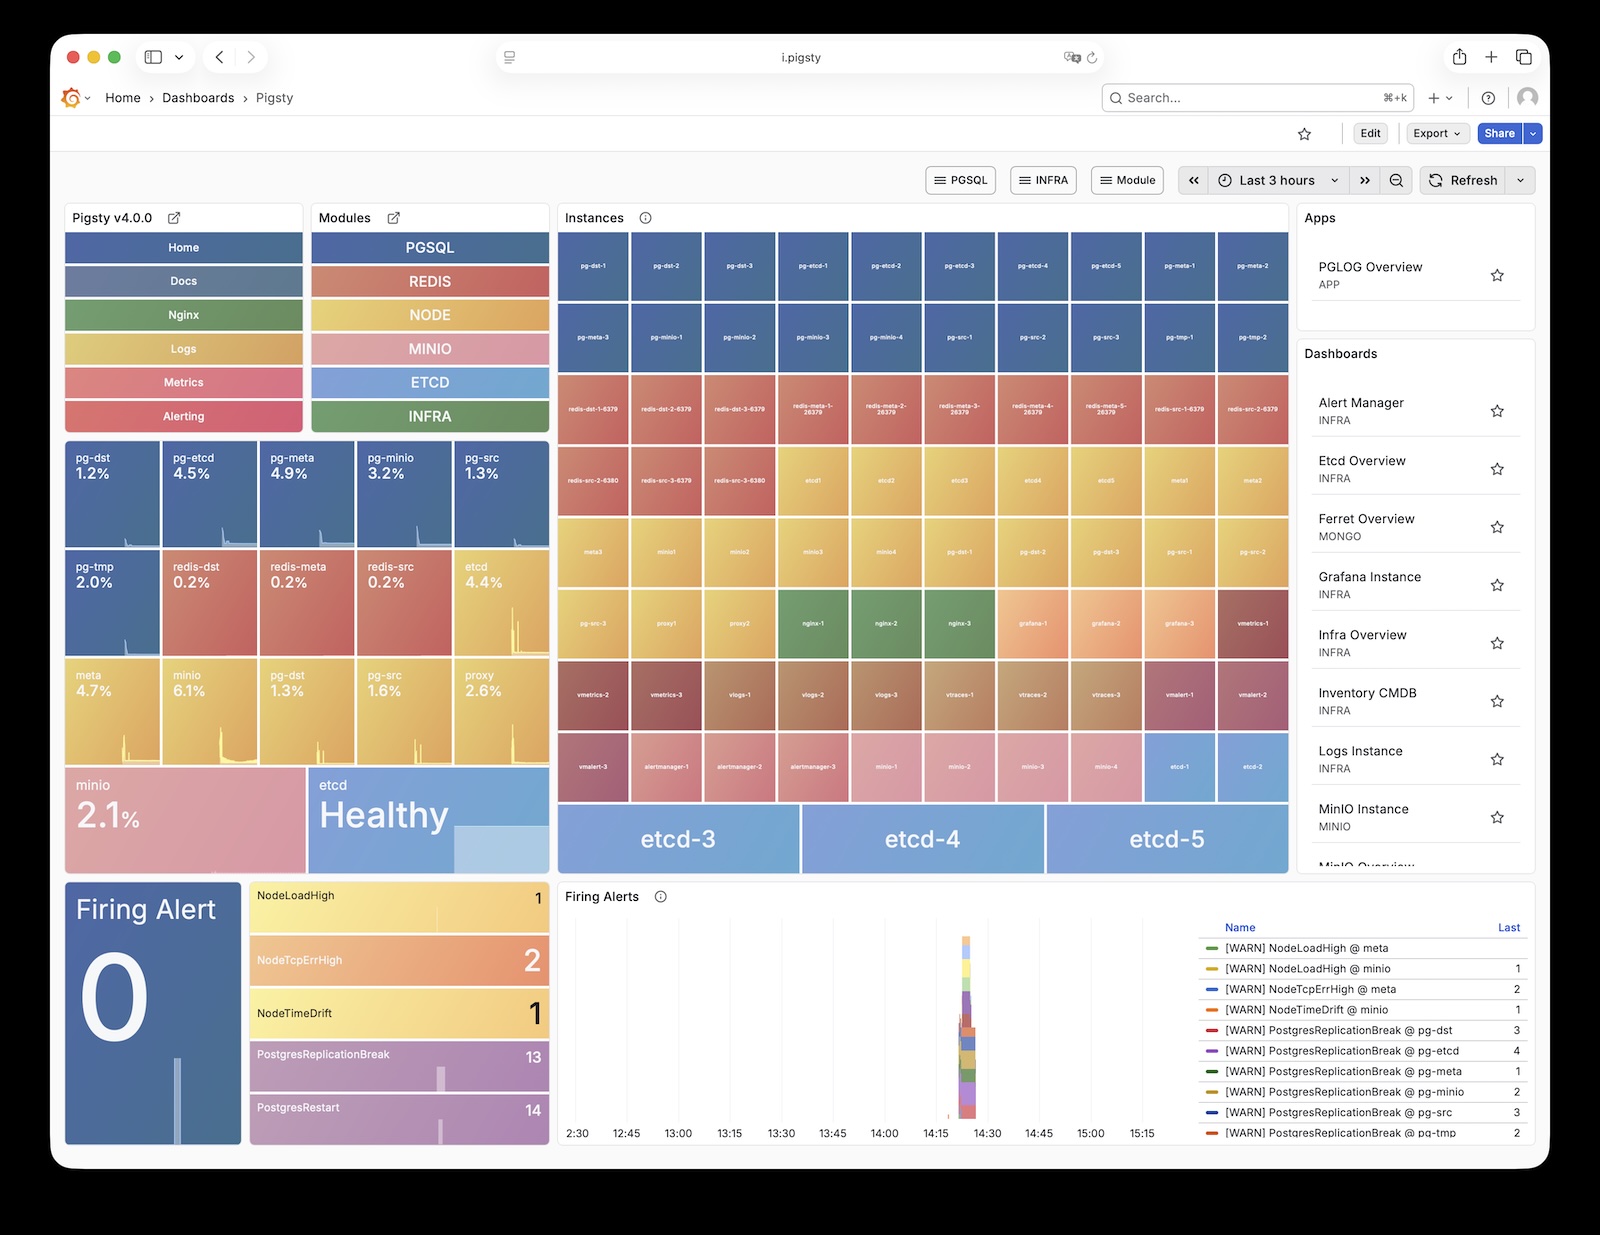
Grafana is the core component of Pigsty’s monitoring system, used for visualizing metrics, logs, and various information. Live Demo
Grafana listens on port 3000 by default and is proxied via Nginx at the /ui path:
| IP Access (replace) | Domain (HTTP) | Domain (HTTPS) | Public Demo |
|---|---|---|---|
http://10.10.10.10/ui |
http://i.pigsty/ui |
https://i.pigsty/ui |
https://demo.pigsty.io/ui |
Pigsty provides pre-built dashboards based on VictoriaMetrics / Logs / Traces, with one-click drill-down and roll-up via URL jumps for rapid troubleshooting.
Grafana can also serve as a low-code visualization platform, so ECharts, victoriametrics-datasource, victorialogs-datasource plugins are installed by default,
with Vector / Victoria datasources registered uniformly as vmetrics-*, vlogs-*, vtraces-* for easy custom dashboard extension.
For more information, see: Config: INFRA - GRAFANA.
VictoriaMetrics
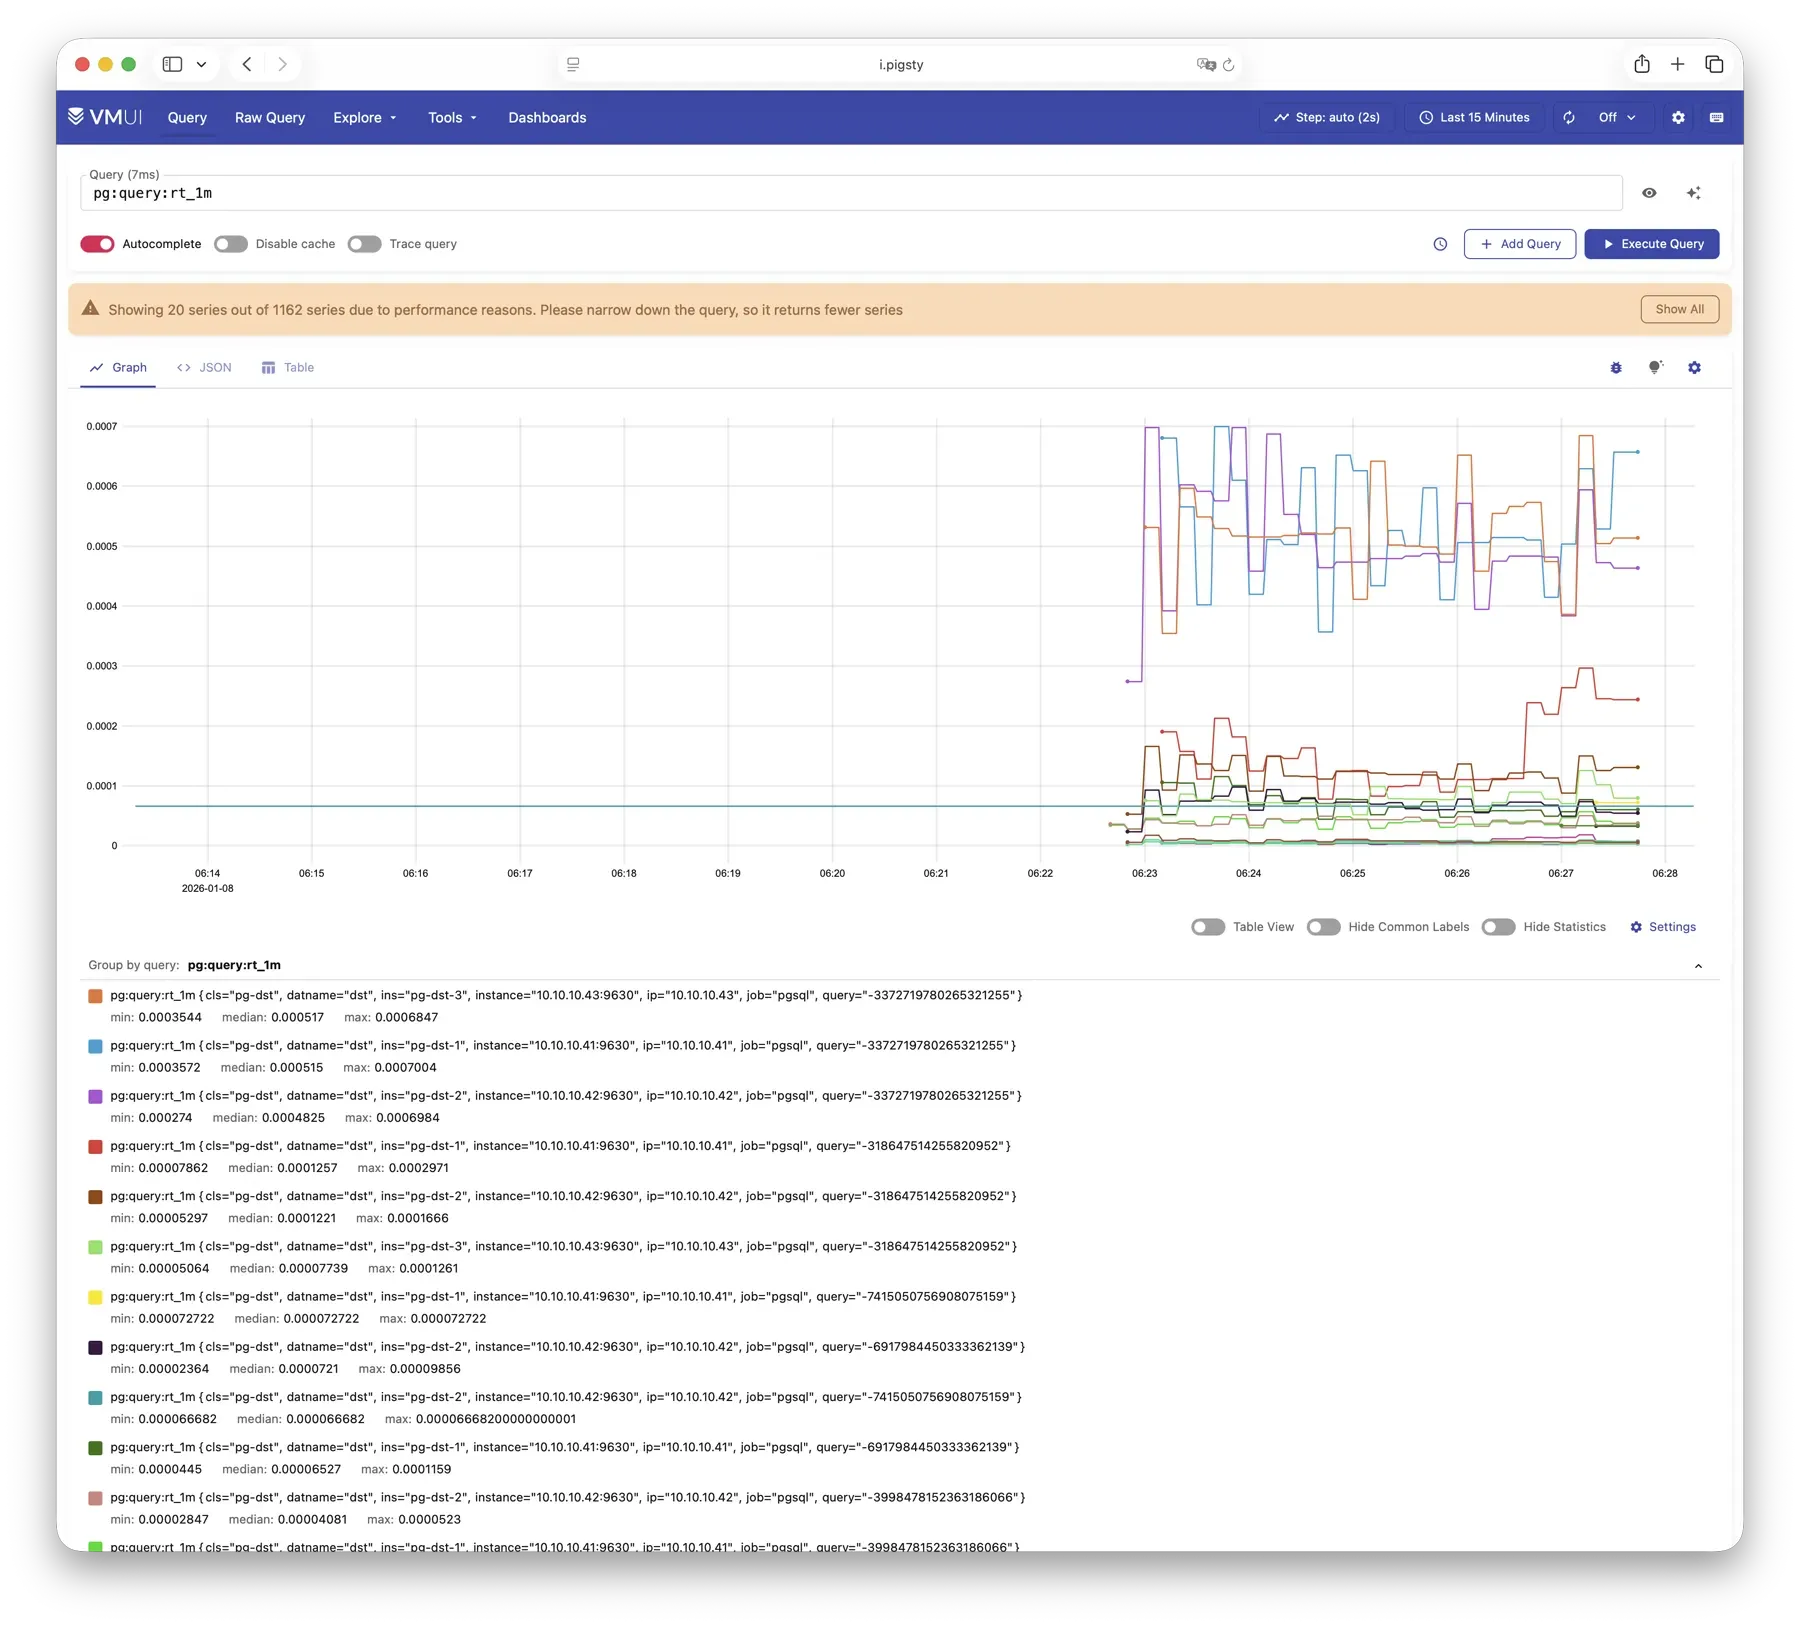
VictoriaMetrics is Pigsty’s time series database, responsible for scraping and storing all monitoring metrics. Live Demo
It listens on port 8428 by default, mounted at Nginx /vmetrics path, and also accessible via the p.pigsty domain:
| IP Access (replace) | Domain (HTTP) | Domain (HTTPS) | Public Demo |
|---|---|---|---|
http://10.10.10.10/vmetrics |
http://p.pigsty |
https://i.pigsty/vmetrics |
https://demo.pigsty.io/vmetrics |
VictoriaMetrics is fully compatible with the Prometheus API, supporting PromQL queries, remote read/write protocols, and the Alertmanager API. The built-in VMUI provides an ad-hoc query interface for exploring metrics data directly, and also serves as a Grafana datasource.
For more information, see: Config: INFRA - VMETRICS
VictoriaLogs
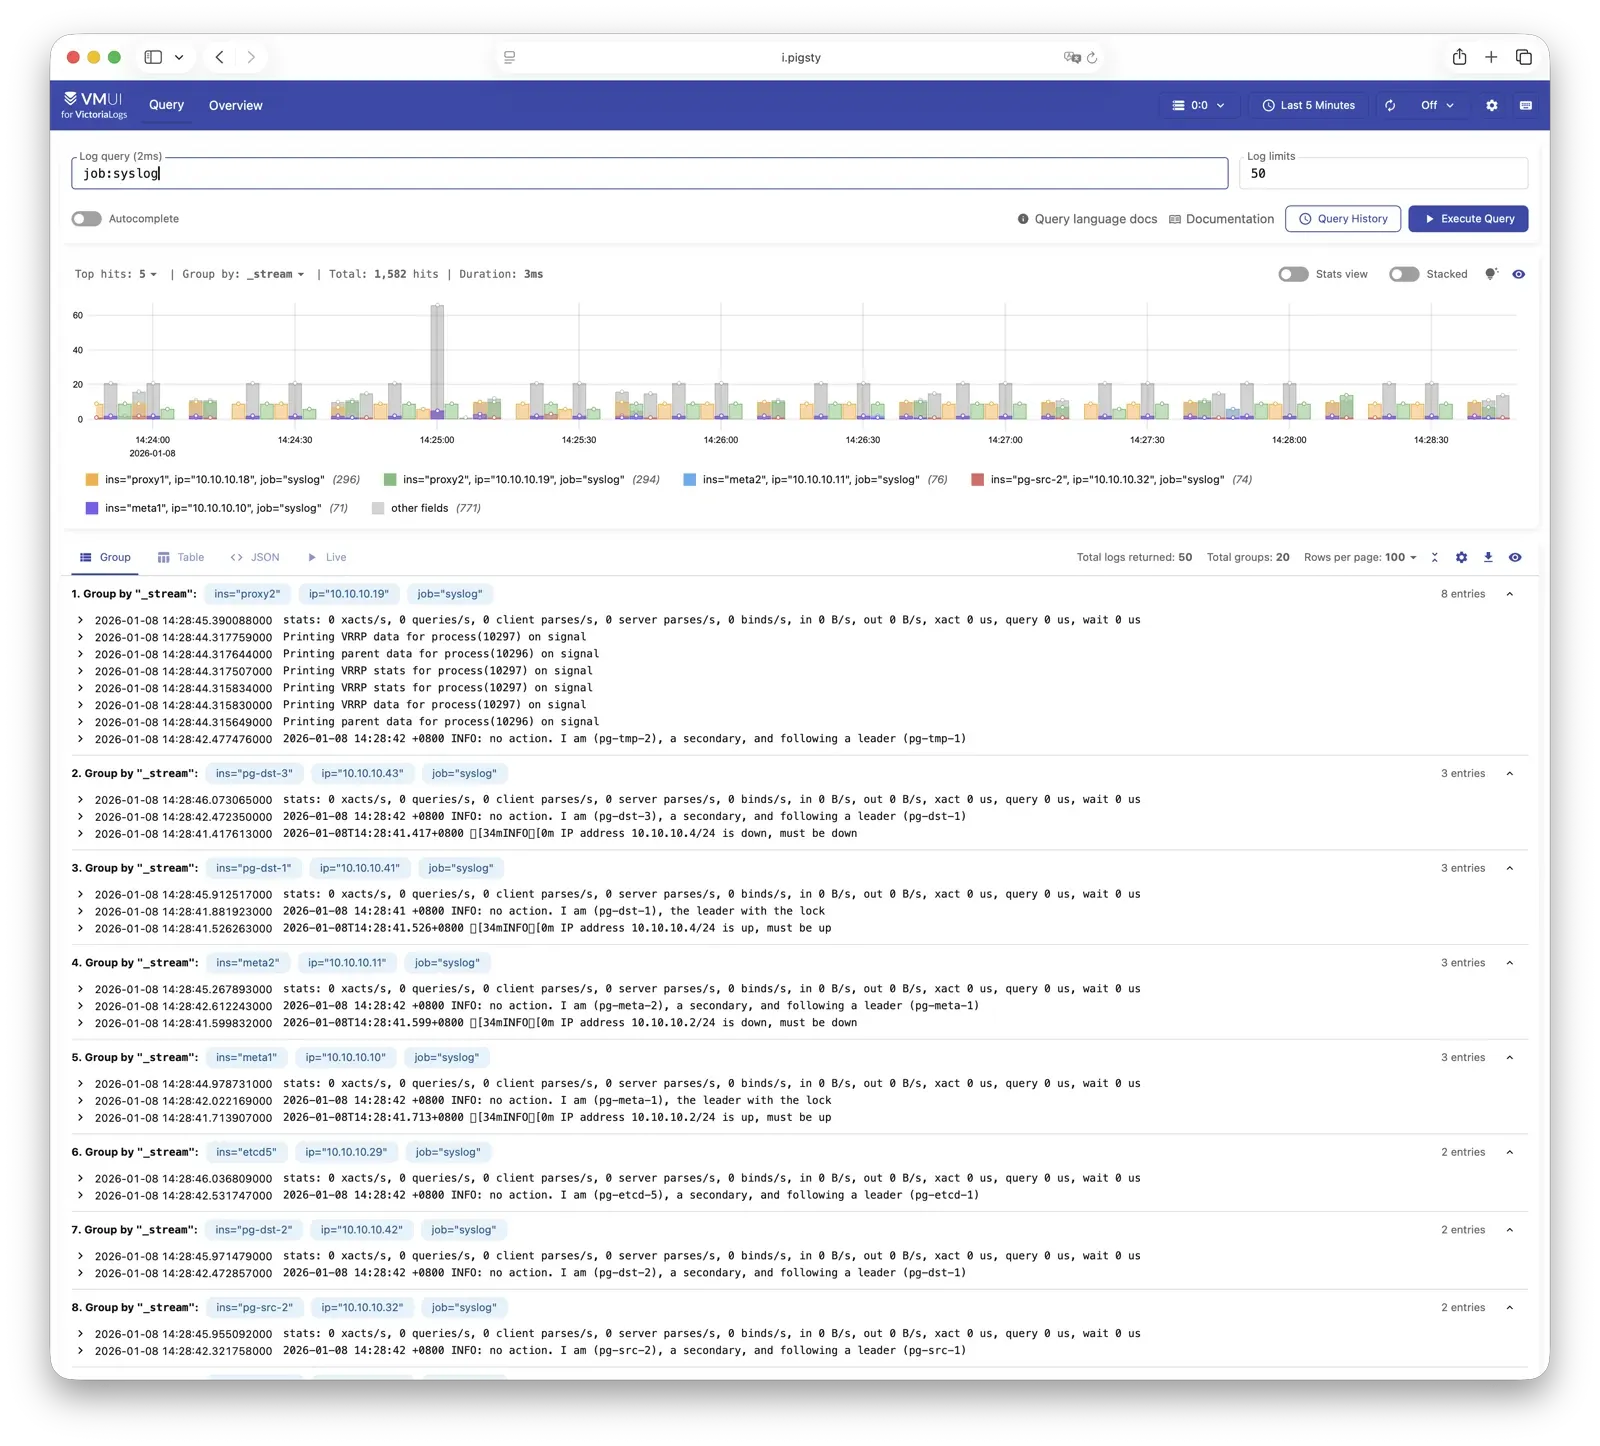
VictoriaLogs is Pigsty’s log platform, centrally storing structured logs from all nodes. Live Demo
It listens on port 9428 by default, mounted at Nginx /vlogs path:
| IP Access (replace) | Domain (HTTP) | Domain (HTTPS) | Public Demo |
|---|---|---|---|
http://10.10.10.10/vlogs |
http://i.pigsty/vlogs |
https://i.pigsty/vlogs |
https://demo.pigsty.io/vlogs |
All managed nodes run Vector Agent by default, collecting system logs, PostgreSQL logs, Patroni logs, Pgbouncer logs, etc., processing them into structured format and pushing to VictoriaLogs. The built-in Web UI supports log search and filtering, and can be integrated with Grafana’s victorialogs-datasource plugin for visual analysis.
For more information, see: Config: INFRA - VLOGS
VictoriaTraces
VictoriaTraces is used for collecting trace data and slow SQL records. Live Demo
It listens on port 10428 by default, mounted at Nginx /vtraces path:
| IP Access (replace) | Domain (HTTP) | Domain (HTTPS) | Public Demo |
|---|---|---|---|
http://10.10.10.10/vtraces |
http://i.pigsty/vtraces |
https://i.pigsty/vtraces |
https://demo.pigsty.io/vtraces |
VictoriaTraces provides a Jaeger-compatible interface for analyzing service call chains and database slow queries. Combined with Grafana dashboards, it enables rapid identification of performance bottlenecks and root cause tracing.
For more information, see: Config: INFRA - VTRACES
VMAlert
VMAlert is the alerting rule computation engine, responsible for evaluating alert rules and pushing triggered events to Alertmanager. Live Demo
It listens on port 8880 by default, mounted at Nginx /vmalert path:
| IP Access (replace) | Domain (HTTP) | Domain (HTTPS) | Public Demo |
|---|---|---|---|
http://10.10.10.10/vmalert |
http://i.pigsty/vmalert |
https://i.pigsty/vmalert |
https://demo.pigsty.io/vmalert |
VMAlert reads metrics data from VictoriaMetrics and periodically evaluates alerting rules. Pigsty provides pre-built alerting rules for PGSQL, NODE, REDIS, and other modules, covering common failure scenarios out of the box.
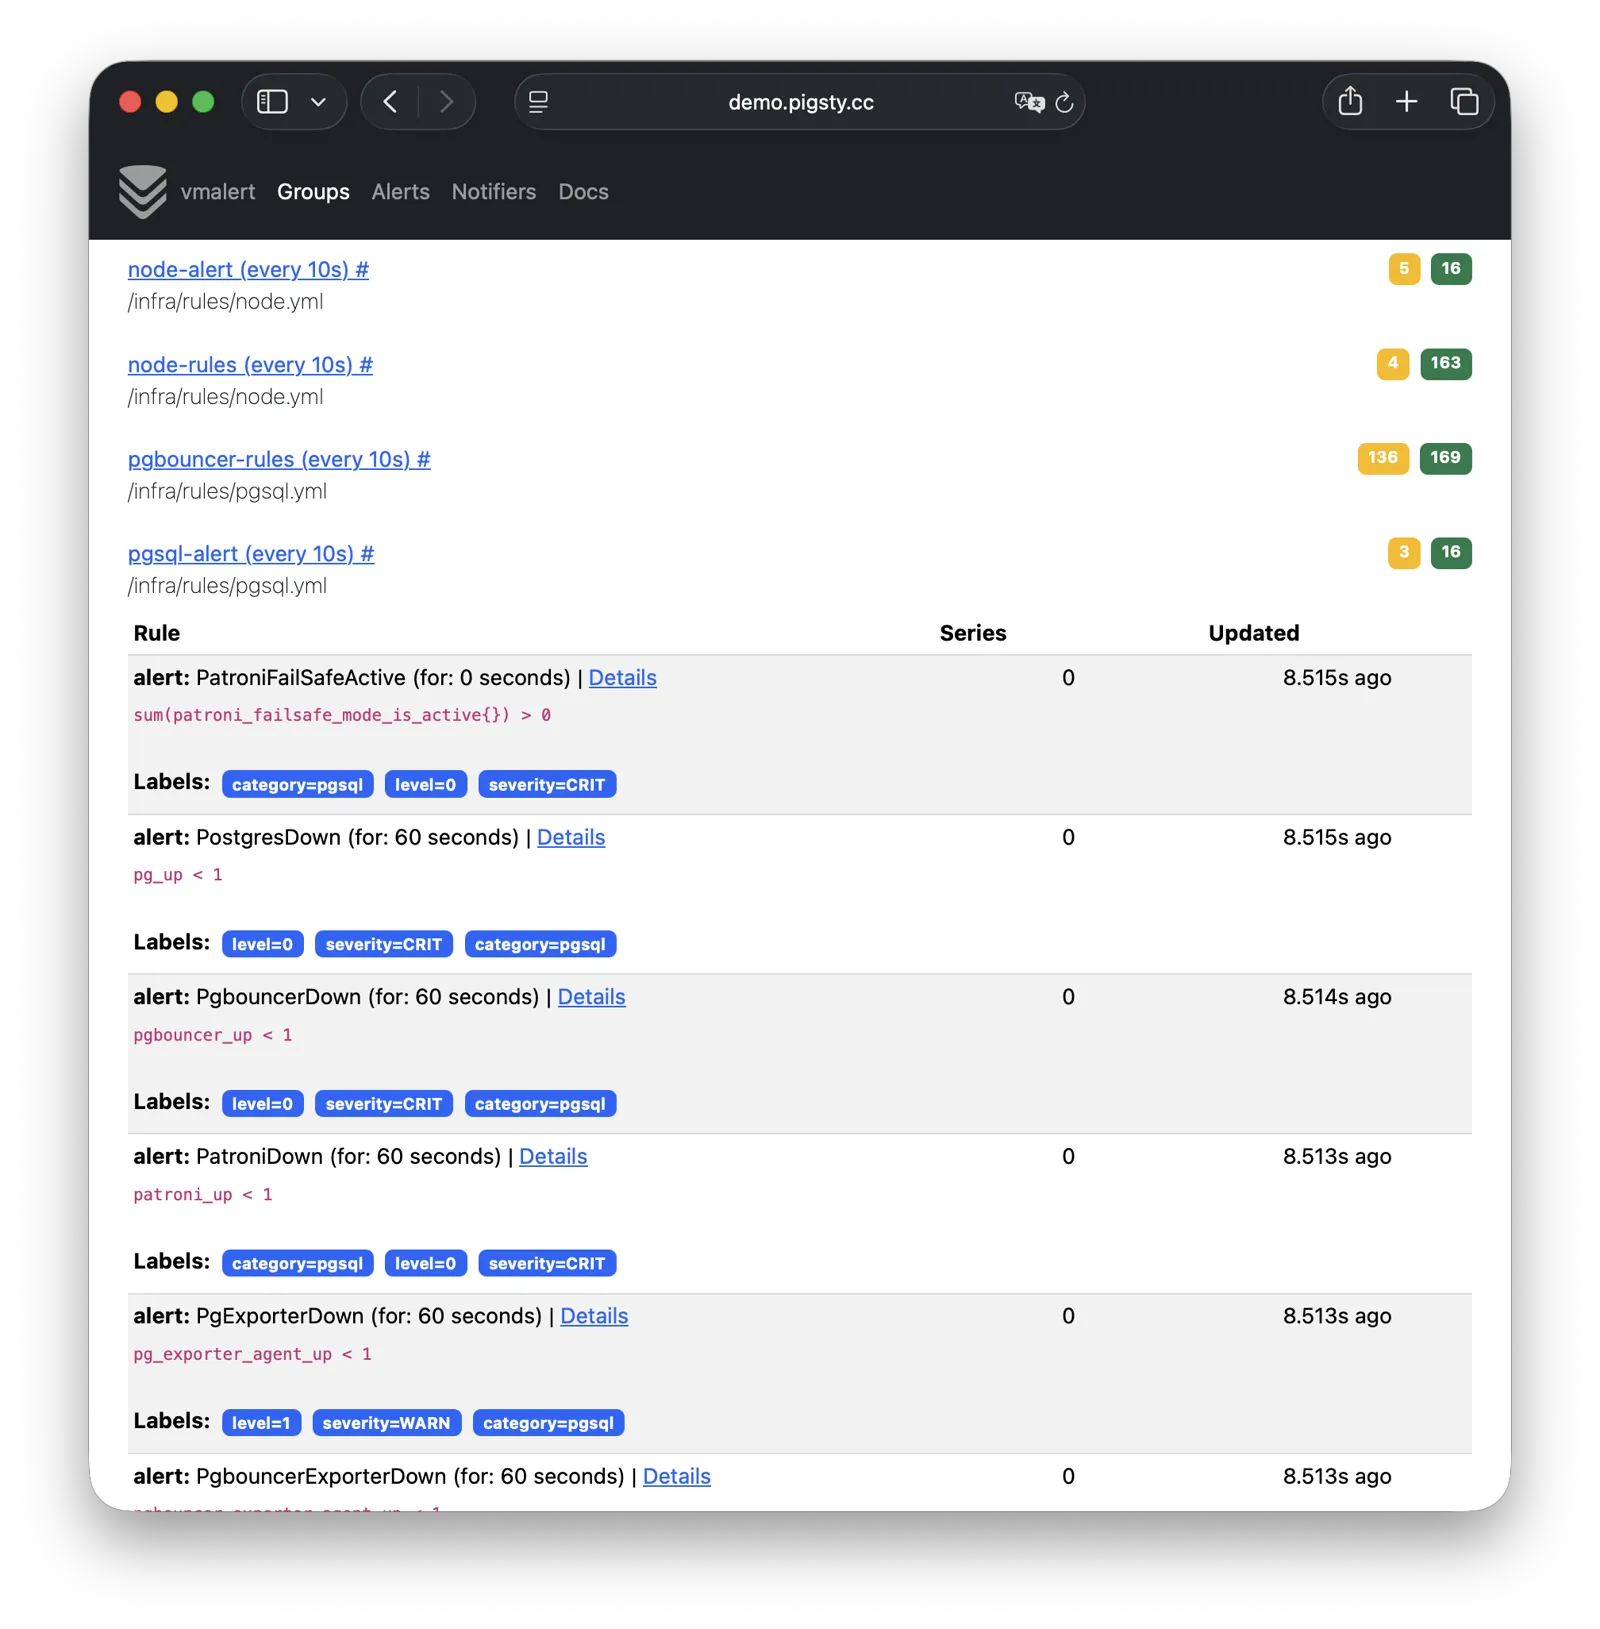
For more information, see: Config: INFRA - VMALERT
AlertManager
AlertManager handles alert event aggregation, deduplication, grouping, and dispatch. Live Demo
It listens on port 9059 by default, mounted at Nginx /alertmgr path, and also accessible via the a.pigsty domain:
| IP Access (replace) | Domain (HTTP) | Domain (HTTPS) | Public Demo |
|---|---|---|---|
http://10.10.10.10/alertmgr |
http://a.pigsty |
https://i.pigsty/alertmgr |
https://demo.pigsty.io/alertmgr |
AlertManager supports multiple notification channels: email, Webhook, Slack, PagerDuty, WeChat Work, etc. Through alert routing rules, differentiated dispatch based on severity level and module type is possible, with support for silencing, inhibition, and other advanced features.
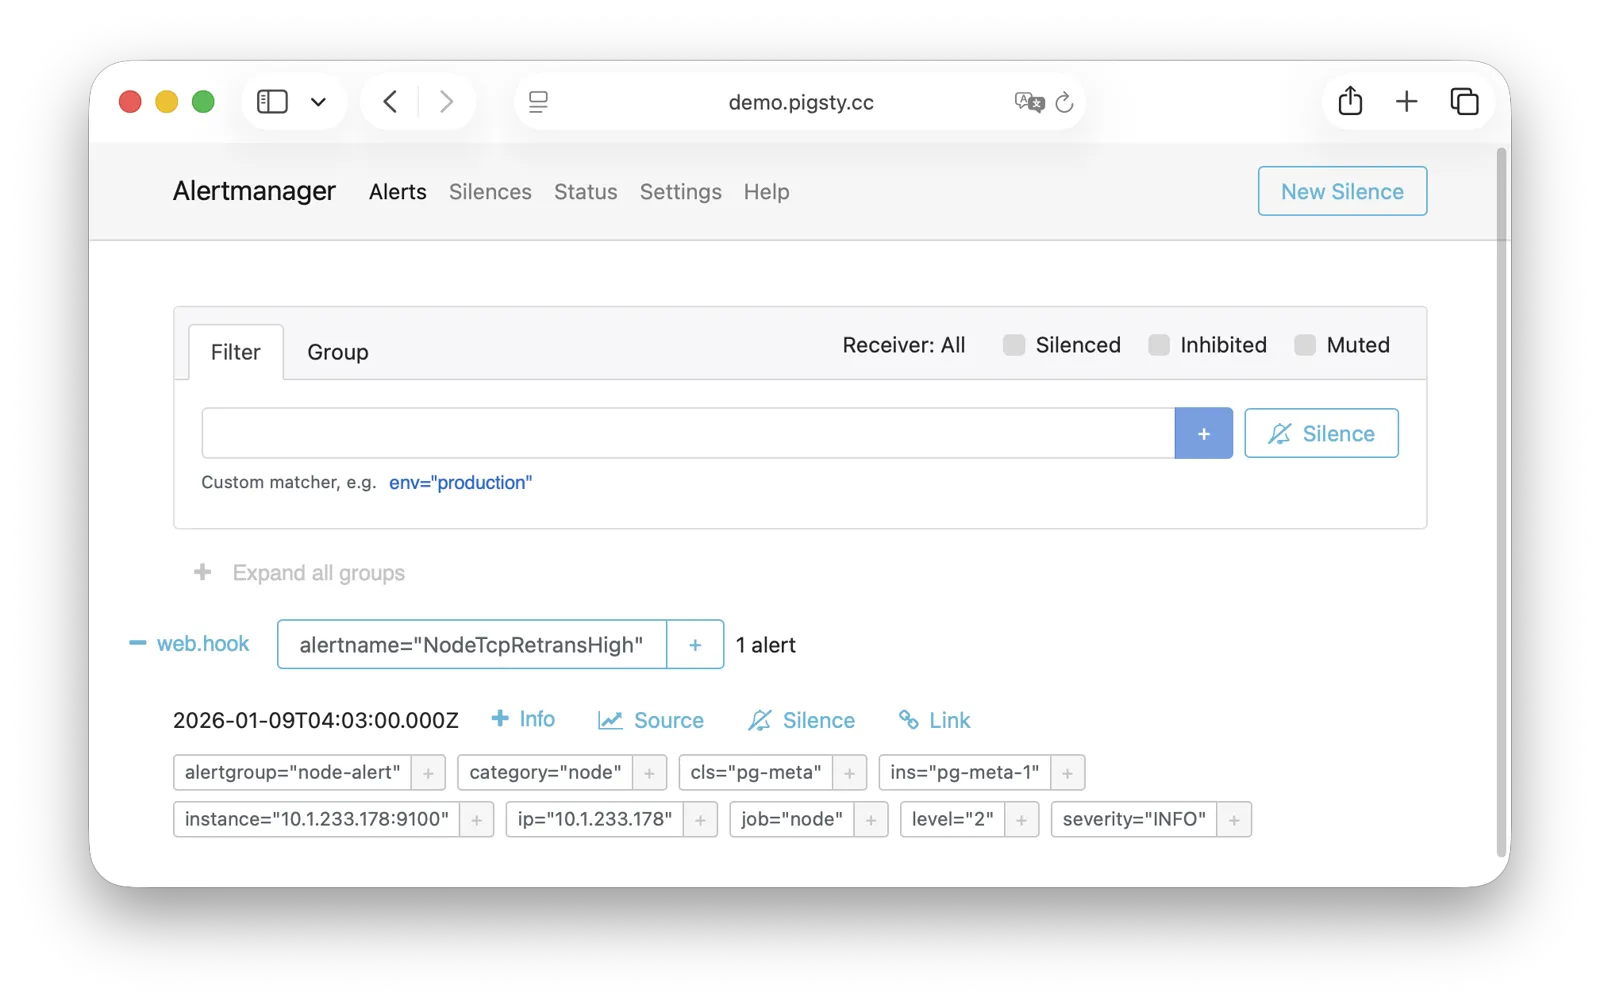
For more information, see: Config: INFRA - AlertManager
BlackboxExporter
Blackbox Exporter is used for active probing of target reachability, enabling blackbox monitoring.
It listens on port 9115 by default, mounted at Nginx /blackbox path:
| IP Access (replace) | Domain (HTTP) | Domain (HTTPS) | Public Demo |
|---|---|---|---|
http://10.10.10.10/blackbox |
http://i.pigsty/blackbox |
https://i.pigsty/blackbox |
https://demo.pigsty.io/blackbox |
It supports multiple probe methods including ICMP Ping, TCP ports, and HTTP/HTTPS endpoints. Useful for monitoring VIP reachability, service port availability, external dependency health, etc.—an important tool for assessing failure impact scope.
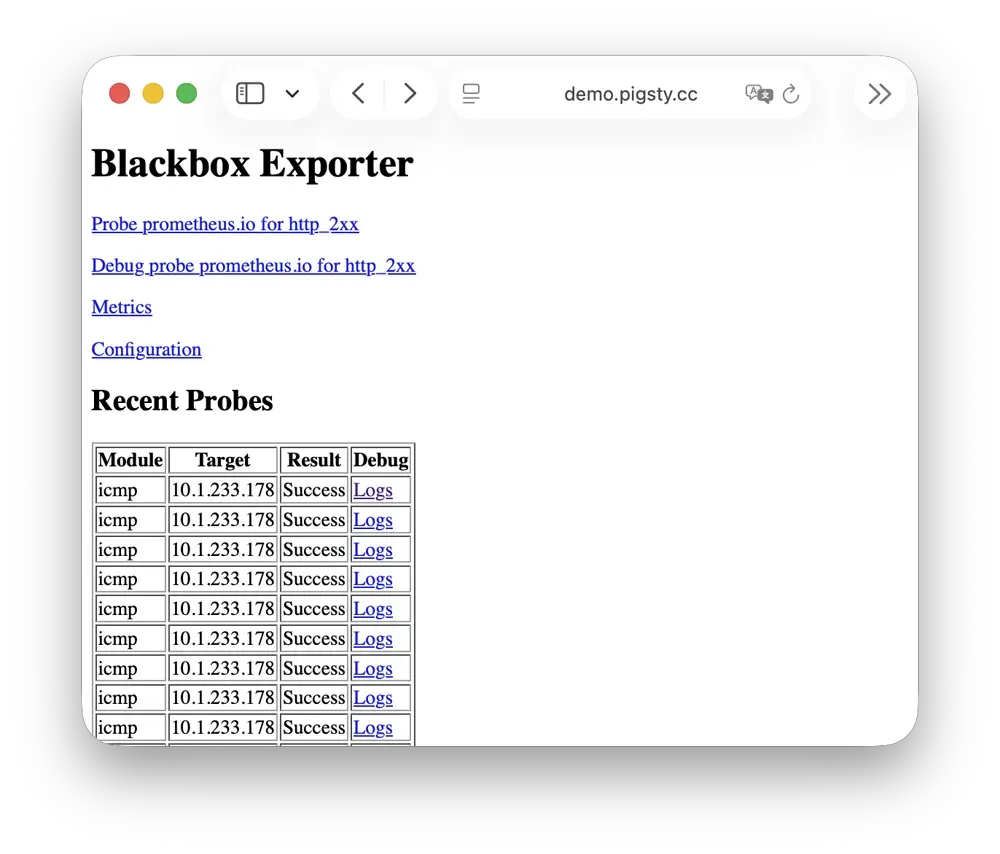
For more information, see: Config: INFRA - BLACKBOX
Ansible
Ansible is Pigsty’s core orchestration tool; all deployment, configuration, and management operations are performed through Ansible Playbooks.
Pigsty automatically installs Ansible on the admin node (Infra node) during installation. It adopts a declarative configuration style and idempotent playbook design: the same playbook can be run repeatedly, and the system automatically converges to the desired state without side effects.
Ansible’s core advantages:
- Agentless: Executes remotely via SSH, no additional software needed on target nodes.
- Declarative: Describes the desired state rather than execution steps; configuration is documentation.
- Idempotent: Multiple executions produce consistent results; supports retry after partial failures.
For more information, see: Playbooks: Pigsty Playbook
DNSMASQ
DNSMASQ provides DNS resolution on INFRA nodes, resolving domain names to their corresponding IP addresses.
DNSMASQ listens on port 53 (UDP/TCP) by default, providing DNS resolution for all nodes. Records are stored in the /etc/dnsmasq.d/pigsty directory.
Other modules automatically register their domain names with DNSMASQ during deployment, which you can use as needed. DNS is completely optional—Pigsty works normally without it. Client nodes can configure INFRA nodes as their DNS servers, allowing access to services via domain names without remembering IP addresses.
dns_records: Default DNS records written to INFRA nodesnode_dns_servers: Configure DNS servers for nodes, defaults to INFRA node viaadmin_ip(can also be disabled)
For more information, see: Config: INFRA - DNS and Tutorial: DNS—Configure Domain Resolution
Chronyd
Chronyd provides NTP time synchronization, ensuring consistent clocks across all nodes. It listens on port 123 (UDP) by default as the time source.
Time synchronization is critical for distributed systems: log analysis requires aligned timestamps, certificate validation depends on accurate clocks, and PostgreSQL streaming replication is sensitive to clock drift. In isolated network environments, the INFRA node can serve as an internal NTP server with other nodes synchronizing to it.
In Pigsty, all nodes run chronyd by default for time sync. The default upstream is pool.ntp.org public NTP servers.
Chronyd is essentially managed by the Node module, but in isolated networks, you can use admin_ip to point to the INFRA node’s Chronyd service as the internal time source.
In this case, the Chronyd service on the INFRA node serves as the internal time synchronization infrastructure.
For more information, see: Config: NODE - TIME
INFRA Node vs Regular Node
In Pigsty, the relationship between nodes and infrastructure is a weak circular dependency: node_monitor → infra → node
The NODE module itself doesn’t depend on the INFRA module, but the monitoring functionality (node_monitor) requires the monitoring platform and services provided by the infrastructure module.
Therefore, in the infra.yml and deploy playbooks, an “interleaved deployment” technique is used:
- First, initialize the NODE module on all regular nodes, but skip monitoring config since infrastructure isn’t deployed yet.
- Then, initialize the INFRA module on the INFRA node—monitoring is now available.
- Finally, reconfigure monitoring on all regular nodes, connecting to the now-deployed monitoring platform.
If you don’t need “one-shot” deployment of all nodes, you can use phased deployment: initialize INFRA nodes first, then regular nodes.
How Are Nodes Coupled to Infrastructure?
Regular nodes reference an INFRA node via the admin_ip parameter as their infrastructure provider.
For example, when you configure global admin_ip = 10.10.10.10, all nodes will typically use infrastructure services at this IP.
This design allows quick, batch switching of infrastructure providers. Parameters that may reference ${admin_ip}:
| Parameter | Module | Default Value | Description |
|---|---|---|---|
repo_endpoint |
INFRA |
http://${admin_ip}:80 |
Software repo URL |
repo_upstream.baseurl |
INFRA |
http://${admin_ip}/pigsty |
Local repo baseurl |
infra_portal.endpoint |
INFRA |
${admin_ip}:<port> |
Nginx proxy backend |
dns_records |
INFRA |
["${admin_ip} i.pigsty", ...] |
DNS records |
node_default_etc_hosts |
NODE |
["${admin_ip} i.pigsty"] |
Default static DNS |
node_etc_hosts |
NODE |
[] |
Custom static DNS |
node_dns_servers |
NODE |
["${admin_ip}"] |
Dynamic DNS servers |
node_ntp_servers |
NODE |
["pool pool.ntp.org iburst"] |
NTP servers (optional) |
For example, when a node installs software, the local repo points to the Nginx local software repository at admin_ip:80/pigsty. The DNS server also points to DNSMASQ at admin_ip:53.
However, this isn’t mandatory—nodes can ignore the local repo and install directly from upstream internet sources (most single-node config templates); DNS servers can also remain unconfigured, as Pigsty has no DNS dependency.
INFRA Node vs ADMIN Node
The management-initiating ADMIN node typically coincides with the INFRA node.
In single-node deployment, this is exactly the case. In multi-node deployment with multiple INFRA nodes, the admin node is usually the first in the infra group; others serve as backups.
However, exceptions exist. You might separate them for various reasons:
For example, in large-scale production deployments, a classic pattern uses 1-2 dedicated management hosts (tiny VMs suffice) belonging to the DBA team as the control hub, with 2-3 high-spec physical machines (or more!) as monitoring infrastructure. Here, admin nodes are separate from infrastructure nodes. In this case, the admin_ip in your config should point to an INFRA node’s IP, not the current ADMIN node’s IP. This is for historical reasons: initially ADMIN and INFRA nodes were tightly coupled concepts, with separation capabilities evolving later, so the parameter name wasn’t changed.
Another common scenario is managing cloud nodes locally. For example, you can install Ansible on your laptop and specify cloud nodes as “managed targets.” In this case, your laptop acts as the ADMIN node, while cloud servers act as INFRA nodes.
Multiple INFRA Nodes
By default, Pigsty only needs one INFRA node for most requirements. Even if the INFRA module goes down, it won’t affect database services on other nodes.
However, in production environments with high monitoring and alerting requirements, you may want multiple INFRA nodes to improve infrastructure availability. A common deployment uses two Infra nodes for redundancy, monitoring each other… or more nodes to deploy a distributed Victoria cluster for unlimited horizontal scaling.
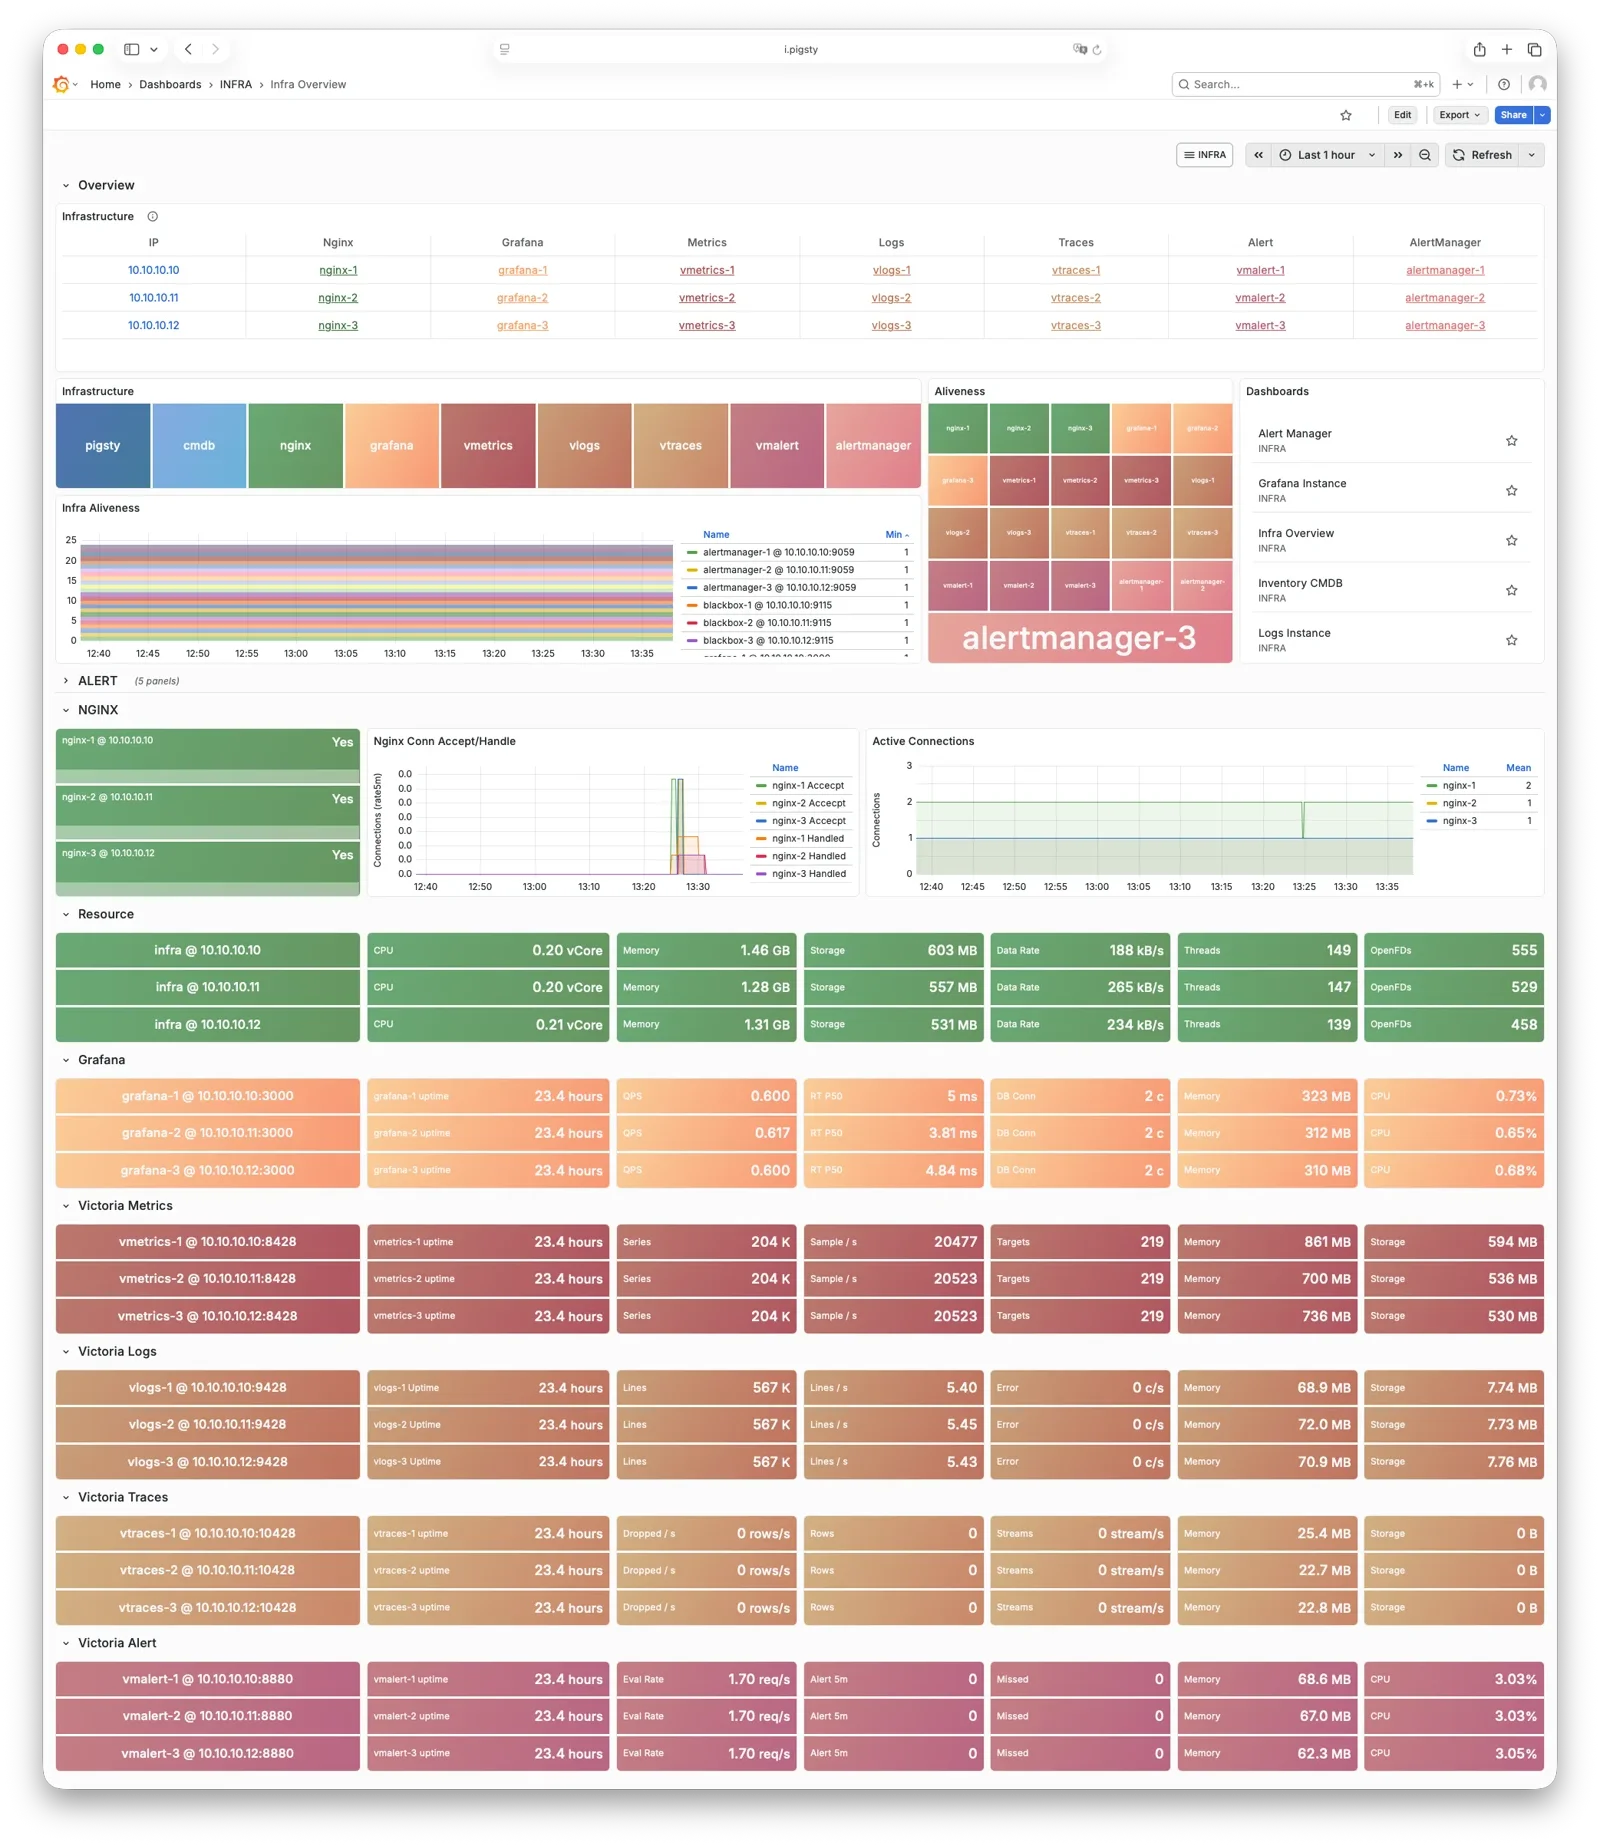
Each Infra node is independent—Nginx points to services on the local machine. VictoriaMetrics independently scrapes metrics from all services in the environment, and logs are pushed to all VictoriaLogs collection endpoints by default. The only exception is Grafana: every Grafana instance registers all VictoriaMetrics / Logs / Traces / PostgreSQL instances as datasources. Therefore, each Grafana instance can see complete monitoring data.
If you modify Grafana—such as adding new dashboards or changing datasource configs—these changes only affect the Grafana instance on that node. To keep Grafana consistent across all nodes, use a PostgreSQL database as shared storage. See Tutorial: Configure Grafana High Availability for details.
3 - PGSQL Arch
The PGSQL module organizes PostgreSQL in production as clusters—logical entities composed of a group of database instances associated by primary-replica relationships.
Overview
The PGSQL module includes the following components, working together to provide production-grade PostgreSQL HA cluster services:
| Component | Type | Description |
|---|---|---|
postgres |
Database | The world’s most advanced open-source relational database, PGSQL core |
patroni |
HA | Manages PostgreSQL, coordinates failover, leader election, config changes |
pgbouncer |
Pool | Lightweight connection pooling middleware, reduces overhead, adds flexibility |
pgbackrest |
Backup | Full/incremental backup and WAL archiving, supports local and object storage |
pg_exporter |
Metrics | Exports PostgreSQL monitoring metrics in a Prometheus-compatible format |
pgbouncer_exporter |
Metrics | Exports Pgbouncer connection pool metrics |
pgbackrest_exporter |
Metrics | Exports backup status metrics |
vip-manager |
VIP | Binds L2 VIP to current primary node for transparent failover [Optional] |
The vip-manager is an on-demand component. Additionally, PGSQL uses components from other modules:
| Component | Module | Type | Description |
|---|---|---|---|
haproxy |
NODE | LB | Exposes service ports, routes traffic to primary or replicas |
vector |
NODE | Logging | Collects PostgreSQL, Patroni, Pgbouncer logs and ships to center |
etcd |
ETCD | DCS | Distributed consistent store for cluster metadata and leader info |
By analogy, the PostgreSQL database kernel is the CPU, while the PGSQL module packages it as a complete computer. Patroni and Etcd form the HA subsystem, while pgBackRest and optional Silo form the backup subsystem. HAProxy, Pgbouncer, and vip-manager form the access subsystem. Various Exporters and Vector build the observability subsystem; finally, you can swap different kernel CPUs and extension cards.

| Subsystem | Components | Function |
|---|---|---|
| HA Subsystem | Patroni + etcd | Failure detection, auto-failover, config management |
| Access Subsystem | HAProxy + Pgbouncer + vip-manager | Service exposure, load balancing, pooling, VIP |
| Backup Subsystem | pgBackRest (+ Silo) | Full/incremental backup, WAL archiving, PITR |
| Observability Subsystem | pg_exporter / pgbouncer_exporter / pgbackrest_exporter + Vector | Metrics collection, log aggregation |
Component Interaction
- Cluster DNS is resolved by DNSMASQ on infra nodes
- Cluster VIP is managed by vip-manager, which binds
pg_vip_addressto the cluster primary node.- vip-manager gets cluster leader info written by patroni from the etcd cluster
- Cluster services are exposed by HAProxy on nodes, different services distinguished by node ports (543x).
- HAProxy port 9101: Monitoring metrics & statistics & admin page
- HAProxy port 5433: Routes to primary pgbouncer: read-write service
- HAProxy port 5434: Routes to replica pgbouncer: read-only service
- HAProxy port 5436: Routes to primary postgres: default service
- HAProxy port 5438: Routes to offline postgres: offline service
- HAProxy routes traffic based on health check info from patroni.
- Pgbouncer is connection pooling middleware, listening on port 6432 by default, buffering connections, exposing additional metrics, and providing extra flexibility.
- PostgreSQL listens on port 5432, providing relational database services
- Installing PGSQL module on multiple nodes with the same cluster name automatically forms an HA cluster via streaming replication
- PostgreSQL process is managed by patroni by default.
- Patroni listens on port 8008 by default, supervising PostgreSQL server processes
- pg_exporter exposes postgres monitoring metrics on port 9630
- pgbouncer_exporter exposes pgbouncer metrics on port 9631
- pgBackRest uses local backup repository by default (
pgbackrest_method=local)- If using
local(default), pgBackRest creates local repository underpg_fs_bkupon primary node - If using
minio, pgBackRest creates the backup repository on dedicated Silo or an external S3 service
- If using
- Vector collects Postgres-related logs (postgres, pgbouncer, patroni, pgbackrest)
HA Subsystem
The HA subsystem consists of Patroni and etcd, responsible for PostgreSQL cluster failure detection, automatic failover, and configuration management.
How it works: Patroni runs on each node, managing the local PostgreSQL process and writing cluster state (leader, members, config) to etcd. When the primary fails, Patroni coordinates election via etcd, promoting the healthiest replica to new primary. The entire process is automatic, with RTO typically under 45 seconds.
Key Interactions:
- PostgreSQL: Starts, stops, reloads PG as parent process, controls its lifecycle
- etcd: External dependency, writes/watches leader key for distributed consensus and failure detection
- HAProxy: Provides health checks via REST API (
:8008), reporting instance role - vip-manager: Watches leader key in etcd, auto-migrates VIP
For more information, see: High Availability and Config: PGSQL - PG_BOOTSTRAP
Access Subsystem
The access subsystem consists of HAProxy, Pgbouncer, and vip-manager, responsible for service exposure, traffic routing, and connection pooling.
There are multiple access methods. A typical traffic path is: Client → DNS/VIP → HAProxy (543x) → Pgbouncer (6432) → PostgreSQL (5432)
| Layer | Component | Port | Role |
|---|---|---|---|
| L2 VIP | vip-manager | - | Binds L2 VIP to primary (optional) |
| L4 Load Bal | HAProxy | 543x | Service exposure, load balancing, health checks |
| L7 Pool | Pgbouncer | 6432 | Connection reuse, session management, transaction pooling |
Service Ports:
5433primary: Read-write service, routes to primary Pgbouncer5434replica: Read-only service, routes to replica Pgbouncer5436default: Default service, direct to primary (bypasses pool)5438offline: Offline service, direct to offline replica (ETL/analytics)
Key Features:
- HAProxy uses Patroni REST API to determine instance role, auto-routes traffic
- Pgbouncer uses transaction-level pooling, absorbs connection spikes, reduces PG connection overhead
- vip-manager watches etcd leader key, auto-migrates VIP during failover
For more information, see: Service Access and Config: PGSQL - PG_ACCESS
Backup Subsystem
The backup subsystem consists of pgBackRest (optionally with Silo or external S3 as a remote repository), responsible for data backup and point-in-time recovery (PITR).
Backup Types:
- Full backup: Complete database copy
- Incremental/differential backup: Only backs up changed data blocks
- WAL archiving: Continuous transaction log archiving, enables any point-in-time recovery
Storage Backends:
local(default): Local disk, backups stored atpg_fs_bkupmount pointminio: S3-compatible object storage, supports centralized backup management and off-site DR
Key Interactions:
- pgBackRest → PostgreSQL: Executes backup commands, manages WAL archiving
- pgBackRest → Patroni: Recovery can bootstrap replicas as new primary or standby
- pgbackrest_exporter → VictoriaMetrics: Exports backup status metrics through the Prometheus-compatible protocol to monitor backup health
For more information, see: PITR, Backup & Recovery, and Config: PGSQL - PG_BACKUP
Observability Subsystem
The observability subsystem consists of three Exporters and Vector, responsible for metrics collection and log aggregation.
| Component | Port | Target | Key Metrics |
|---|---|---|---|
| pg_exporter | 9630 |
PostgreSQL | Sessions, transactions, replication lag, buffer hits |
| pgbouncer_exporter | 9631 |
Pgbouncer | Pool utilization, wait queue, hit rate |
| pgbackrest_exporter | 9854 |
pgBackRest | Latest backup time, size, type |
| vector | 9598 |
postgres/patroni/pgbouncer logs | Structured log stream |
Data Flow:
- Metrics: Exporter → VictoriaMetrics (INFRA) → Grafana dashboards
- Logs: Vector → VictoriaLogs (INFRA) → Grafana log queries
pg_exporter / pgbouncer_exporter connect to target services via local Unix socket, decoupled from HA topology. In slim install mode, these components can be disabled.
For more information, see: Config: PGSQL - PG_MONITOR
PostgreSQL
PostgreSQL is the PGSQL module core, listening on port 5432 by default for relational database services, deployed 1:1 with nodes.
Pigsty currently supports PostgreSQL 14-18 (lifecycle major versions), installed via binary packages from the PGDG official repo. Pigsty also allows you to use other PG kernel forks to replace the default PostgreSQL kernel, and install up to 575 extension plugins on top of the PG kernel.
PostgreSQL processes are managed by default by the HA agent—Patroni. When a cluster has only one node, that instance is the primary; when the cluster has multiple nodes, other instances automatically join as replicas: through physical replication, syncing data changes from the primary in real-time. Replicas can handle read-only requests and automatically take over when the primary fails.
You can access PostgreSQL directly, or through HAProxy and Pgbouncer connection pool.
For more information, see: Config: PGSQL - PG_BOOTSTRAP
Patroni
Patroni is the PostgreSQL HA control component, listening on port 8008 by default.
Patroni takes over PostgreSQL startup, shutdown, configuration, and health status, writing leader and member information to etcd. It handles automatic failover, maintains replication factor, coordinates parameter changes, and provides a REST API for HAProxy, monitoring, and administrators.
HAProxy uses Patroni health check endpoints to determine instance roles and route traffic to the correct primary or replica. vip-manager monitors the leader key in etcd and automatically migrates the VIP when the primary changes.
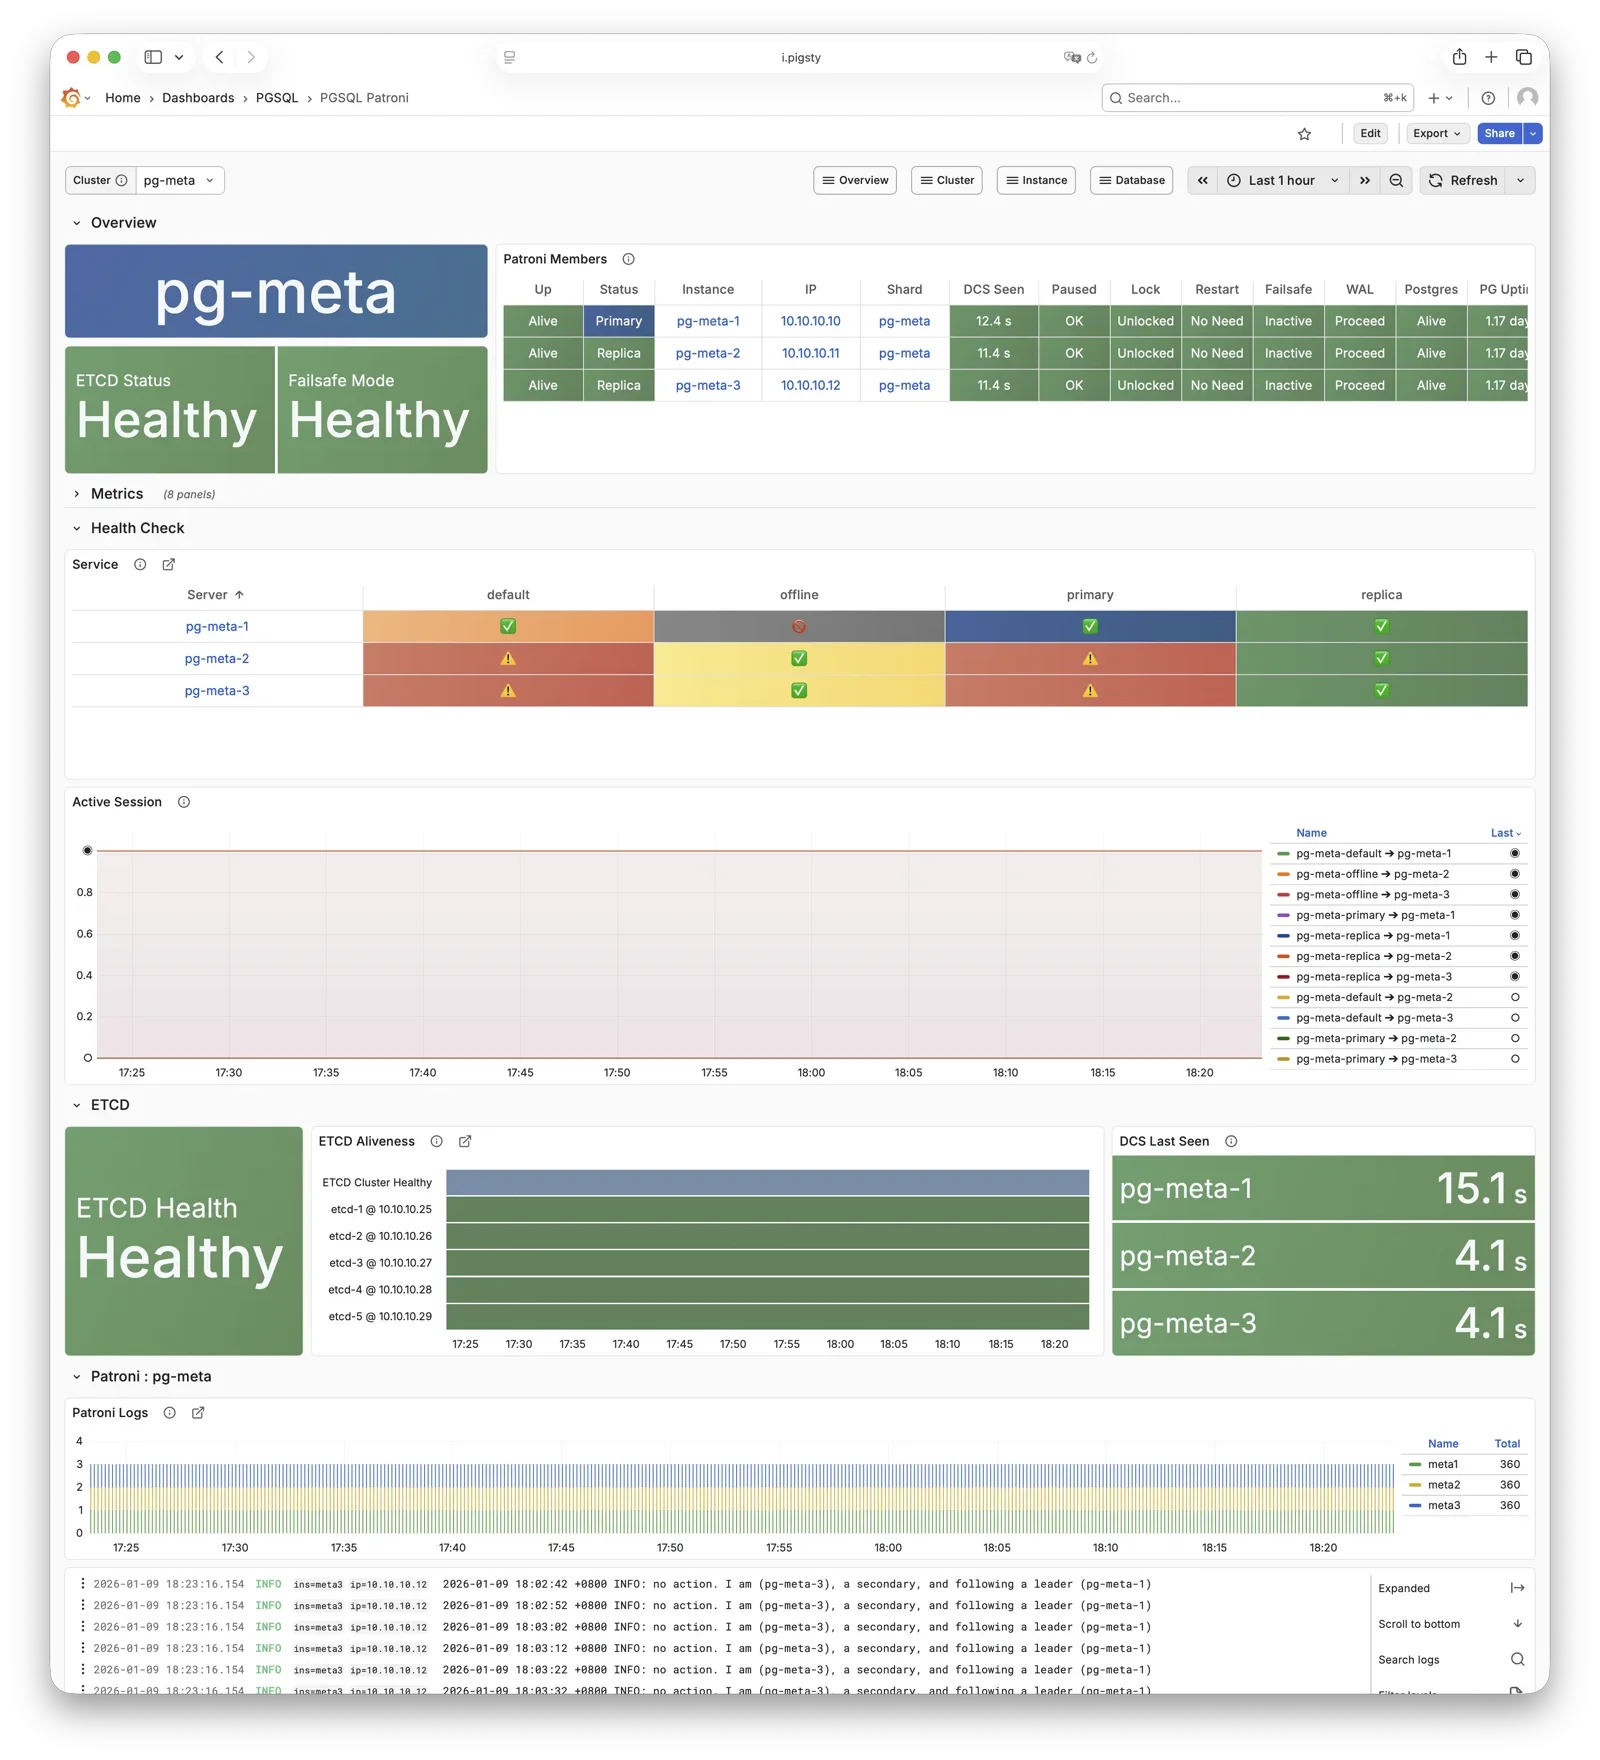
For more information, see: Config: PGSQL - PG_BOOTSTRAP
Pgbouncer
Pgbouncer is a lightweight connection pooling middleware, listening on port 6432 by default, deployed 1:1 with PostgreSQL database and node.
Pgbouncer runs statelessly on each instance, connecting to PostgreSQL via local Unix socket, using Transaction Pooling by default for pool management, absorbing burst client connections, stabilizing database sessions, reducing lock contention, and significantly improving performance under high concurrency.
Pigsty routes production traffic (read-write service 5433 / read-only service 5434) through Pgbouncer by default,
while only the default service (5436) and offline service (5438) bypass the pool for direct PostgreSQL connections.
Pool mode is controlled by pgbouncer_poolmode, defaulting to transaction (transaction-level pooling).
Connection pooling can be disabled via pgbouncer_enabled.
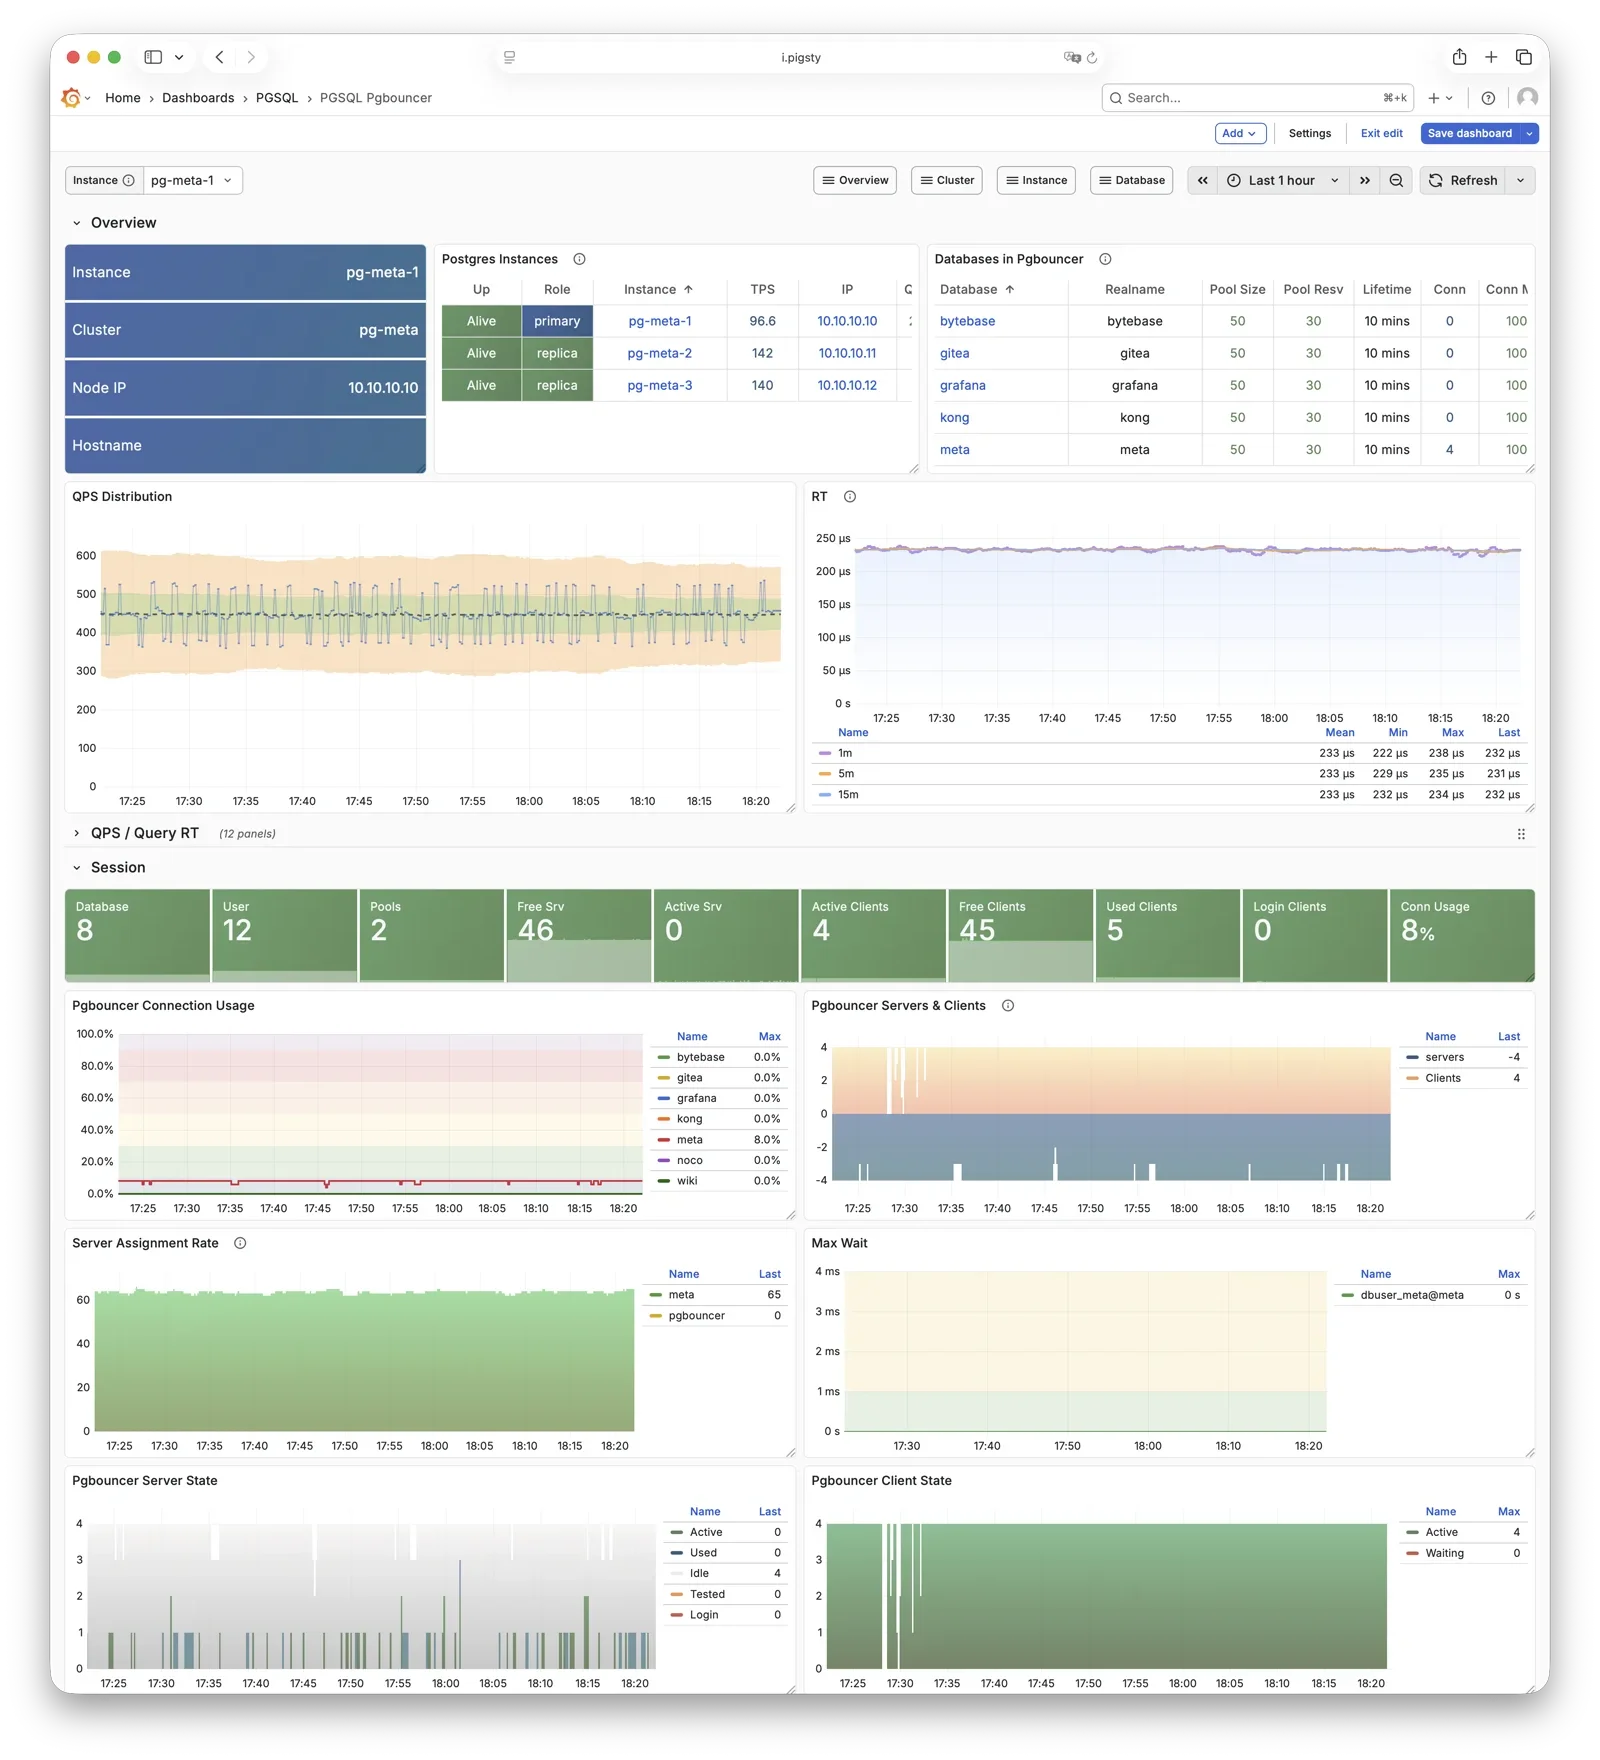
For more information, see: Config: PGSQL - PG_ACCESS
pgBackRest
pgBackRest is a professional PostgreSQL backup/recovery tool, one of the strongest in the PG ecosystem, supporting full/incremental/differential backup and WAL archiving.
Pigsty uses pgBackRest for PostgreSQL PITR capability, allowing you to roll back clusters to any point within the backup retention window.
pgBackRest works with PostgreSQL to create backup repositories on the primary, executing backup and archive tasks.
By default, it uses local backup repository (pgbackrest_method = local),
but can be configured for Silo or external S3 object storage for centralized backup management.
After initialization, pgbackrest_init_backup can automatically trigger the first full backup.
Recovery integrates with Patroni, supporting bootstrapping replicas as new primaries or standbys.
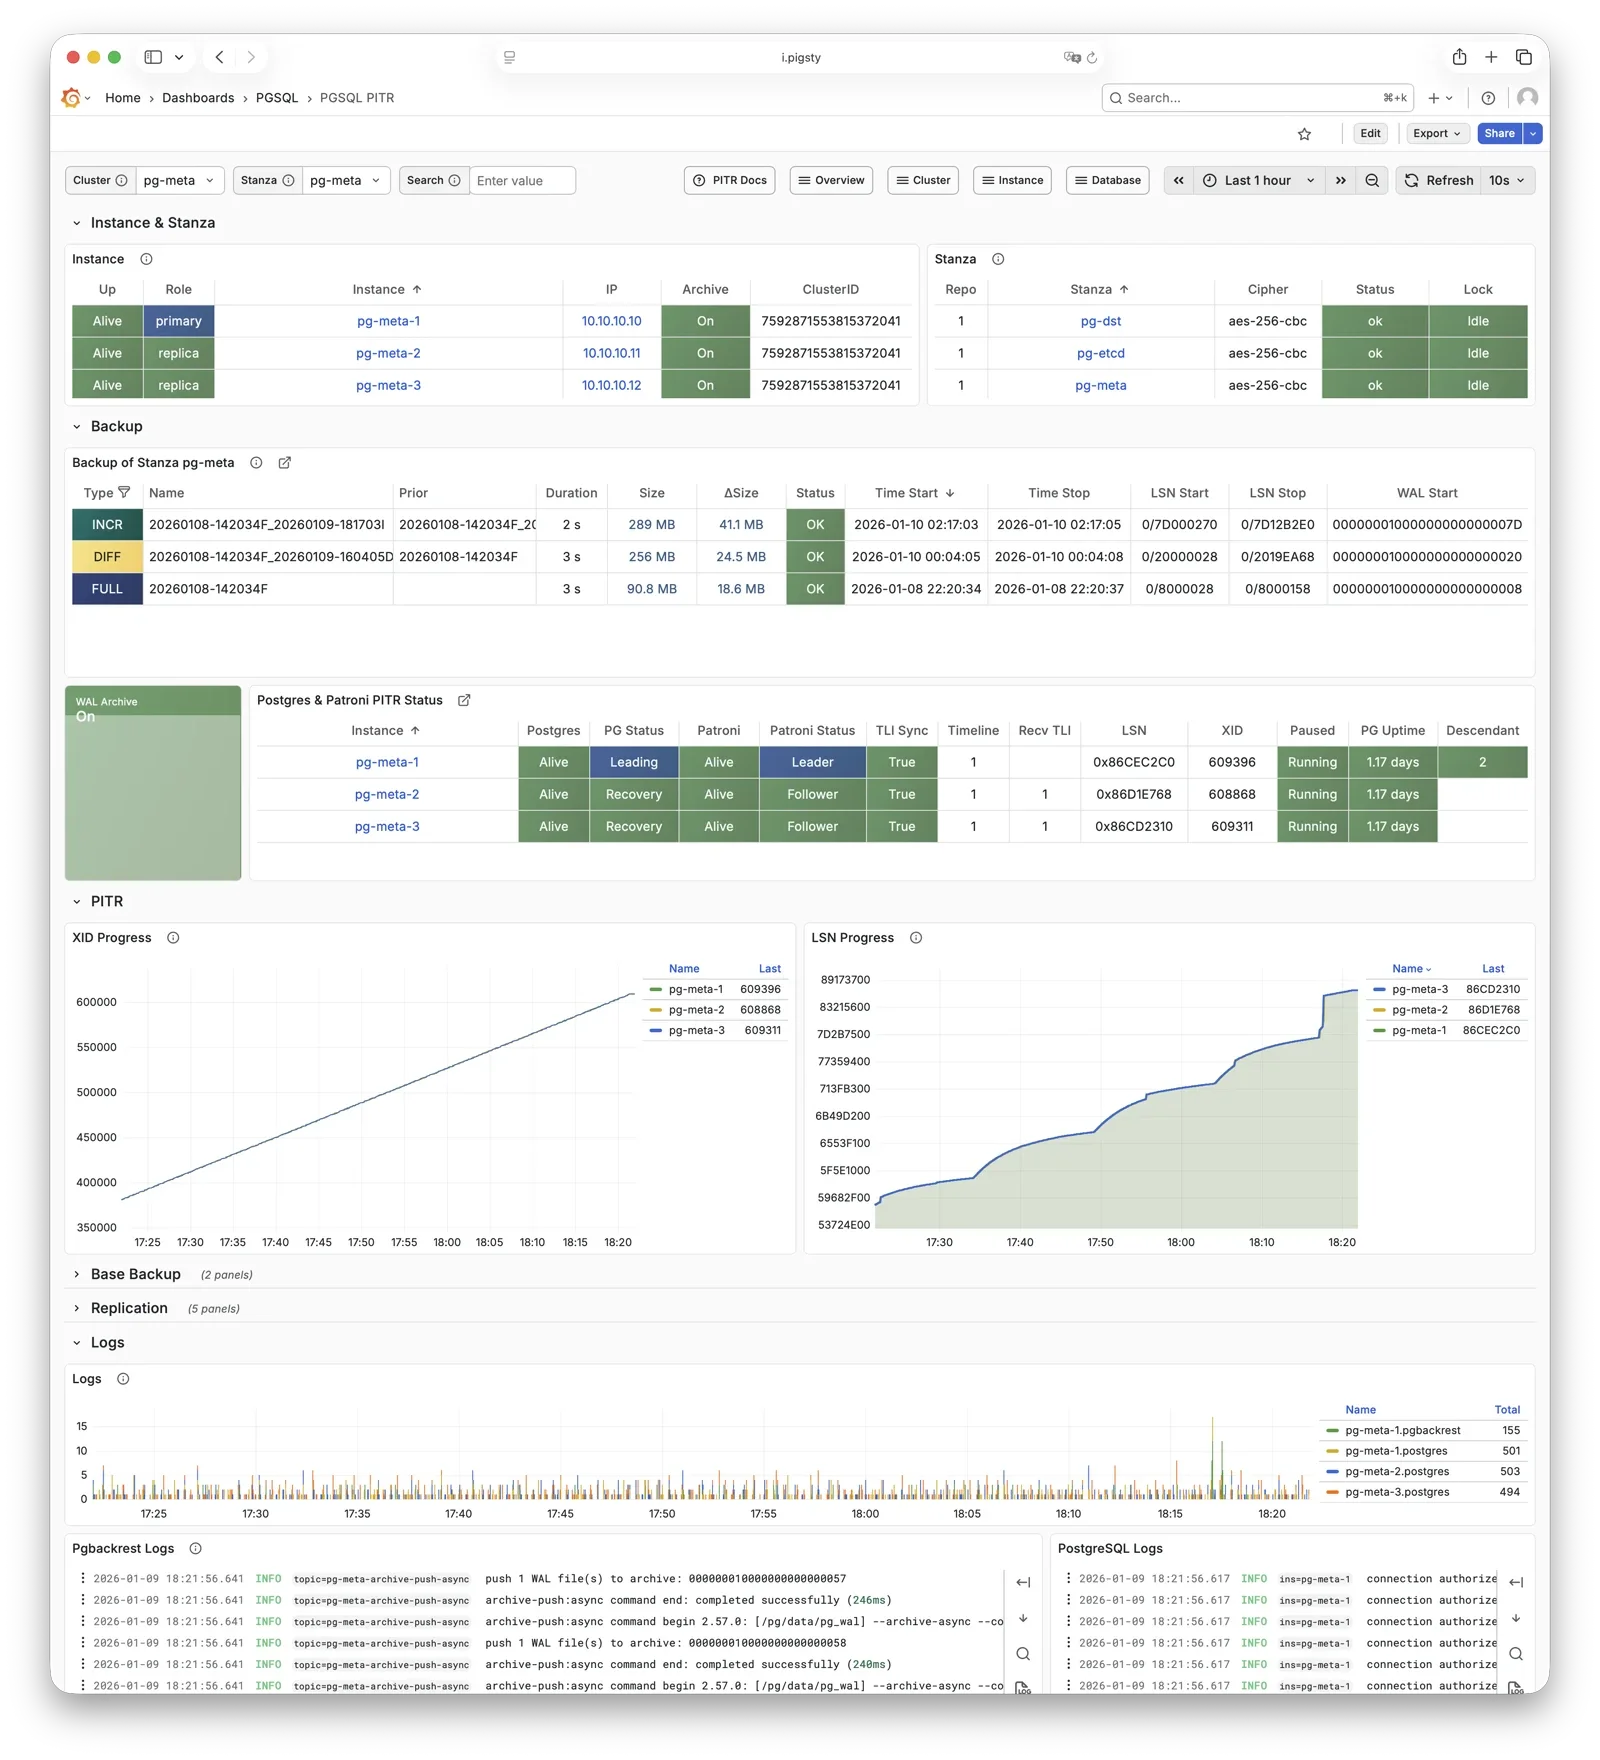
For more information, see: Backup & Recovery and Config: PGSQL - PG_BACKUP
HAProxy
HAProxy is the service entry point and load balancer, exposing multiple database service ports.
| Port | Service | Target | Description |
|---|---|---|---|
9101 |
Admin | - | HAProxy statistics and admin page |
5433 |
primary | Primary Pgbouncer | Read-write service, routes to primary pool |
5434 |
replica | Replica Pgbouncer | Read-only service, routes to replica pool |
5436 |
default | Primary Postgres | Default service, direct to primary (bypasses pool) |
5438 |
offline | Offline Postgres | Offline service, direct to offline replica (ETL/analytics) |
HAProxy uses Patroni REST API health checks to determine instance roles and route traffic to the appropriate primary or replica.
Service definitions are composed from pg_default_services and pg_services.
A dedicated HAProxy node group can be specified via pg_service_provider to handle higher traffic;
by default, HAProxy on local nodes publishes services.
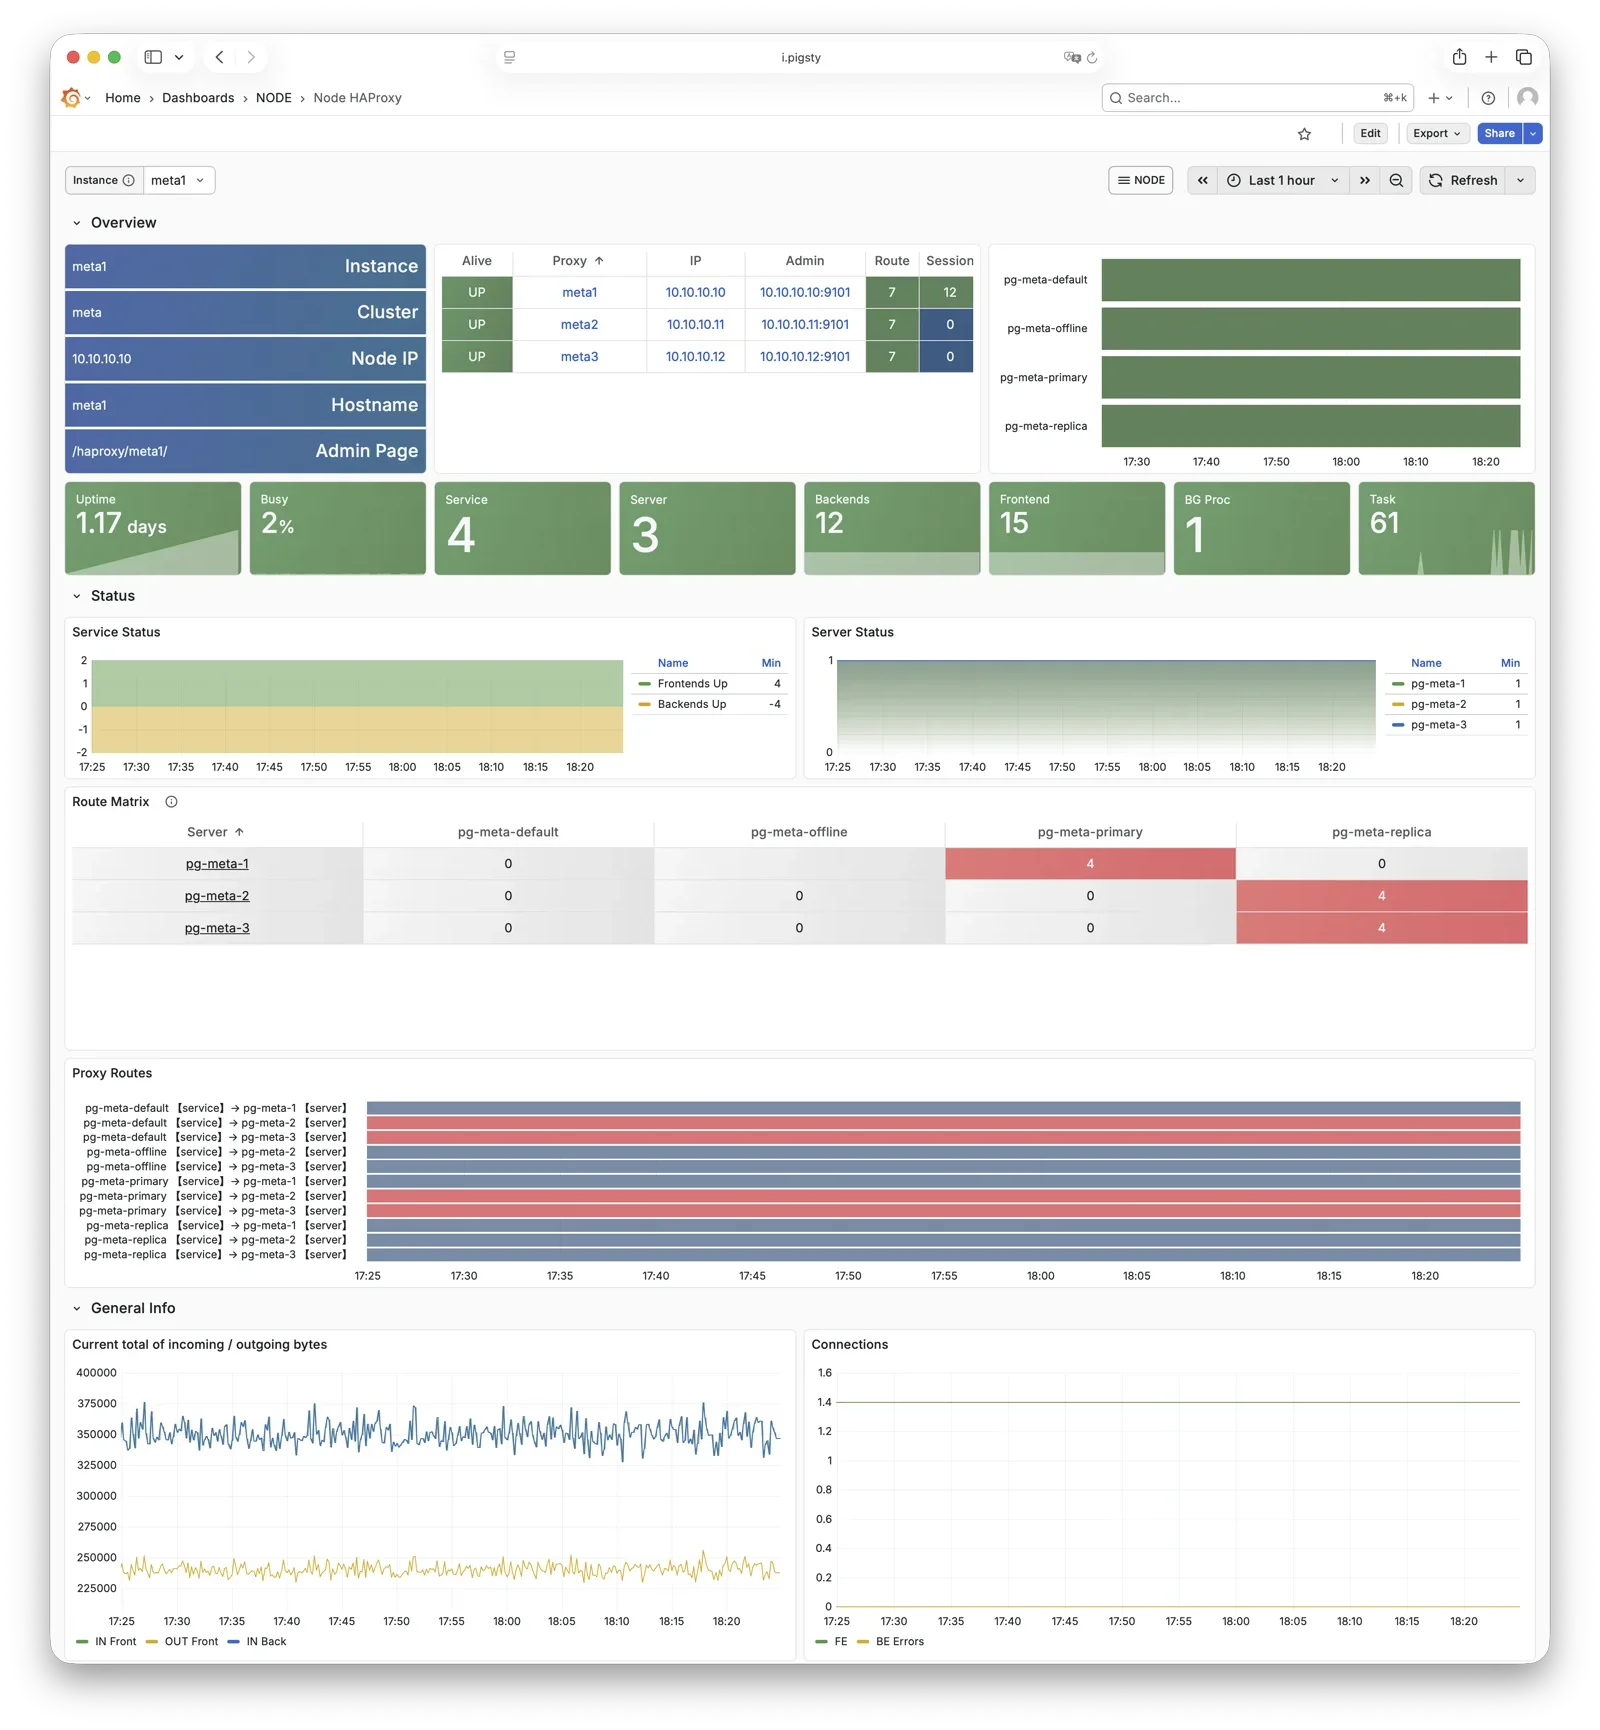
For more information, see: Service Access and Config: PGSQL - PG_ACCESS
vip-manager
vip-manager binds L2 VIP to the current primary node. This is an optional component; enable it if your network supports L2 VIP.
vip-manager runs on each PG node, monitoring the leader key written by Patroni in etcd,
and binds pg_vip_address to the current primary node’s network interface.
When cluster failover occurs, vip-manager immediately releases the VIP from the old primary and rebinds it on the new primary, switching traffic to the new primary.
This component is optional, enabled via pg_vip_enabled.
When enabled, ensure all nodes are in the same VLAN; otherwise, VIP migration will fail.
Public cloud networks typically don’t support L2 VIP; it’s recommended only for on-premises and private cloud environments.
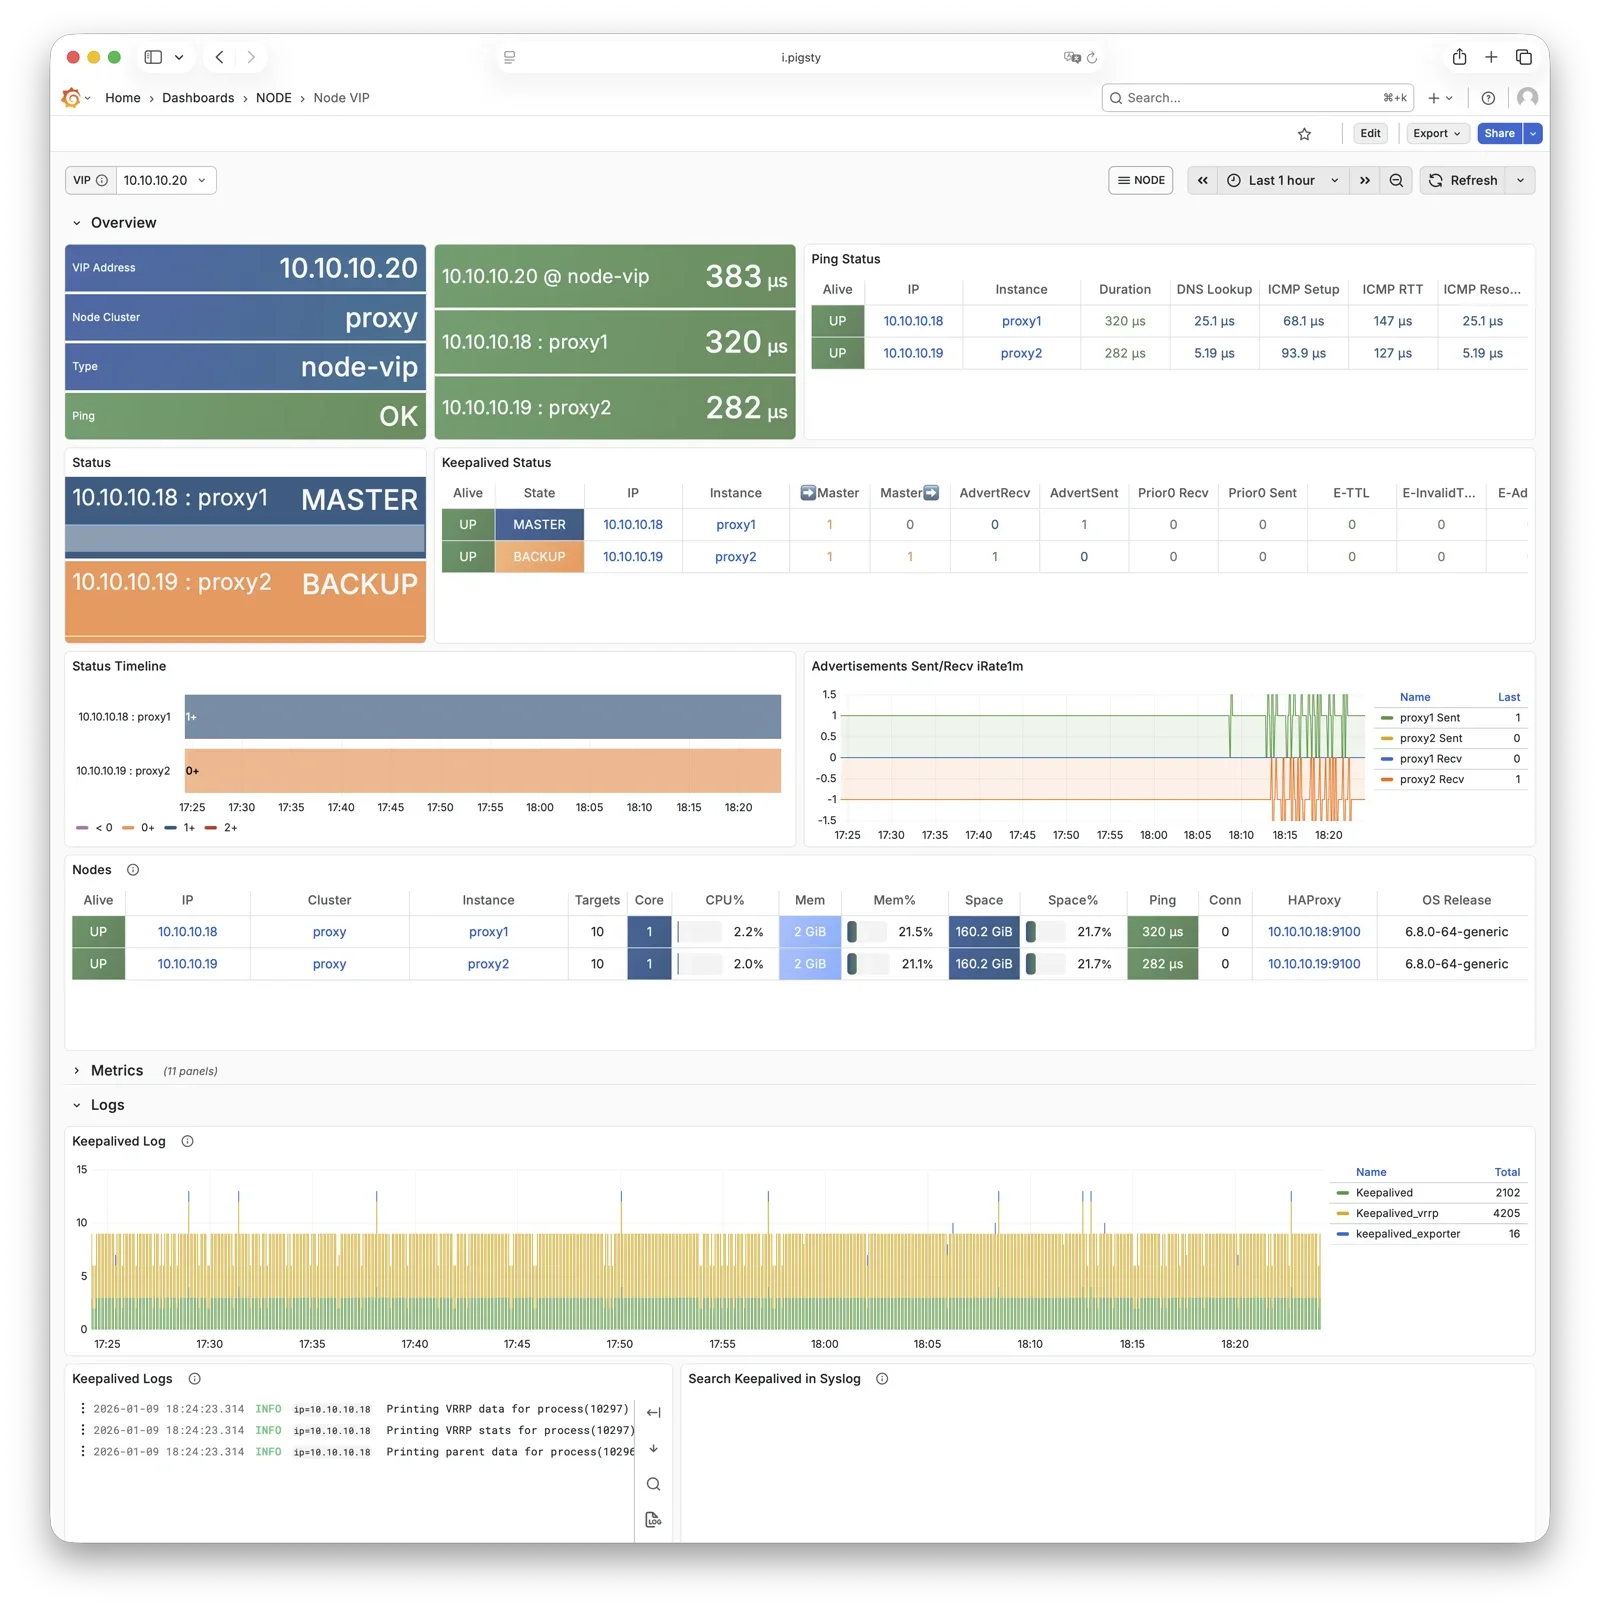
For more information, see: Tutorial: VIP Configuration and Config: PGSQL - PG_ACCESS
pg_exporter
pg_exporter exports PostgreSQL monitoring metrics, listening on port 9630 by default.
pg_exporter runs on each PG node, connecting to PostgreSQL via local Unix socket, exporting rich metrics covering sessions, buffer hits, replication lag, transaction rates, etc., scraped by VictoriaMetrics on INFRA nodes.
Collection configuration is specified by pg_exporter_config,
with support for automatic database discovery (pg_exporter_auto_discovery),
and tiered cache strategies via pg_exporter_cache_ttls.
You can disable this component via parameters; in slim install, this component is not enabled.
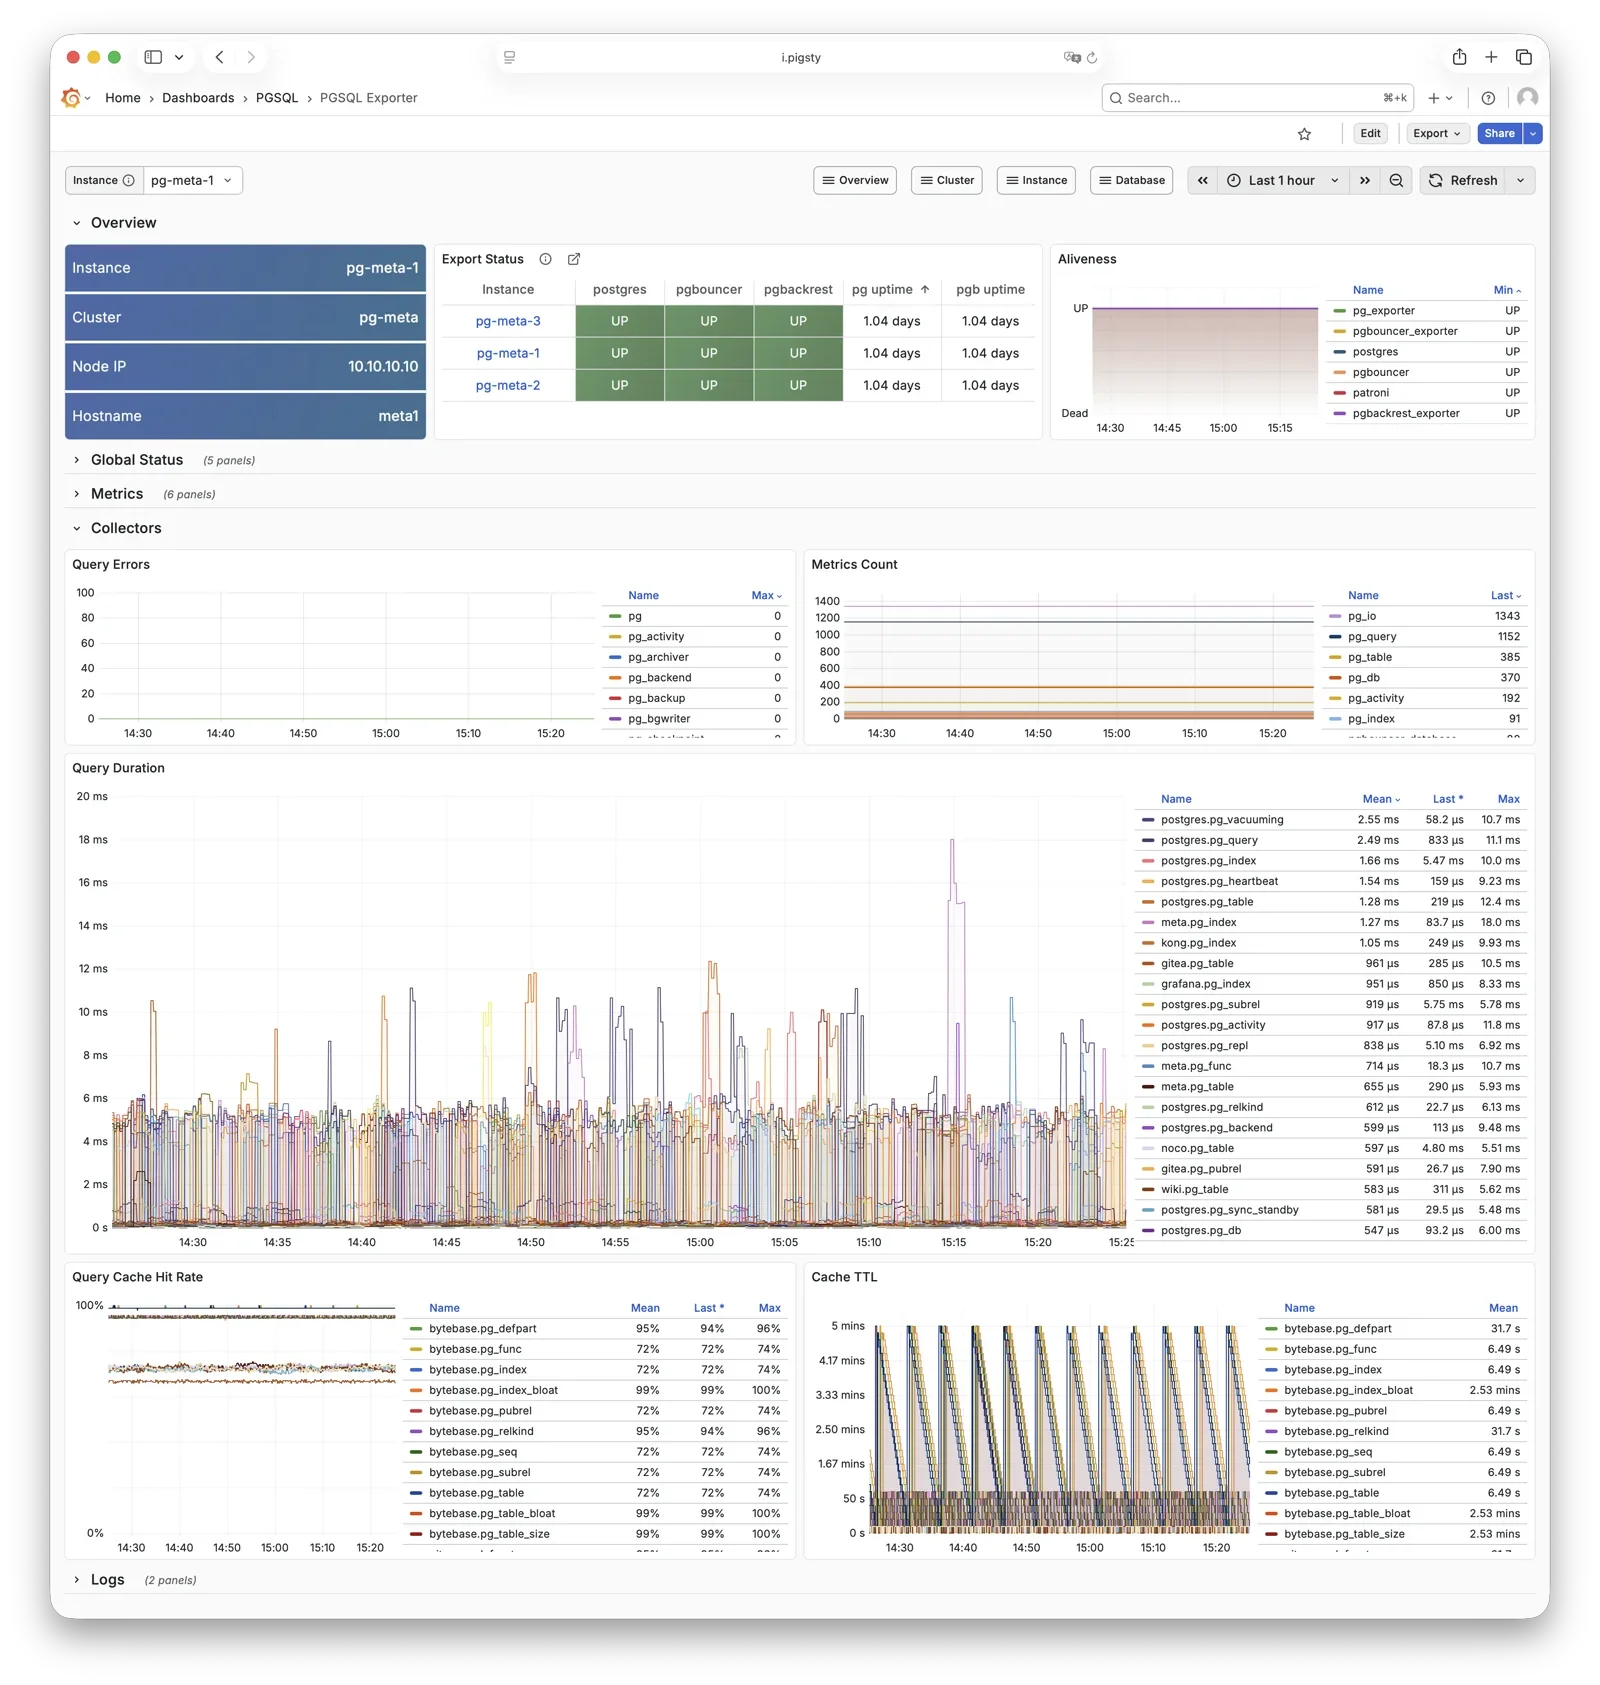
For more information, see: Config: PGSQL - PG_MONITOR
pgbouncer_exporter
pgbouncer_exporter exports Pgbouncer connection pool metrics, listening on port 9631 by default.
pgbouncer_exporter uses the same pg_exporter binary but with a dedicated metrics config file, supporting pgbouncer 1.8-1.25+.
pgbouncer_exporter reads Pgbouncer statistics views, providing pool utilization, wait queue, and hit rate metrics.
If Pgbouncer is disabled, this component is also disabled. In slim install, this component is not enabled.
For more information, see: Config: PGSQL - PG_MONITOR
pgbackrest_exporter
pgbackrest_exporter exports backup status metrics, listening on port 9854 by default.
pgbackrest_exporter parses pgBackRest status, generating metrics for most recent backup time, size, type, etc. Combined with alerting policies, it quickly detects expired or failed backups, ensuring data safety. Note that when there are many backups or using large network repositories, collection overhead can be significant, so pgbackrest_exporter has a default 2-minute collection interval. In the worst case, you may see the latest backup status in the monitoring system 2 minutes after a backup completes.
For more information, see: Config: PGSQL - PG_MONITOR
etcd
etcd is a distributed consistent store (DCS), providing cluster metadata storage and leader election capability for Patroni.
etcd is deployed and managed by the independent ETCD module, not part of the PGSQL module itself, but critical for PostgreSQL HA. Patroni writes cluster state, leader info, and config parameters to etcd; all nodes reach consensus through etcd. vip-manager also reads the leader key from etcd to enable automatic VIP migration.
For more information, see: ETCD Module
vector
Vector is a high-performance log collection component, deployed by the NODE module, responsible for collecting PostgreSQL-related logs.
Vector runs on nodes, tracking PostgreSQL, Pgbouncer, Patroni, and pgBackRest log directories, sending structured logs to VictoriaLogs on INFRA nodes for centralized storage and querying.
For more information, see: NODE Module