This is the multi-page printable view of this section. .
Dashboard
-
1: Overview
- 1.1: PGSQL Overview
- 1.2: PGSQL Alert
- 1.3: PGSQL Shard
-
2: Cluster
- 2.1: PGSQL Cluster
- 2.2: PGRDS Cluster
- 2.3: PGSQL Activity
- 2.4: PGSQL Replication
- 2.5: PGSQL Service
- 2.6: PGSQL Databases
- 2.7: PGSQL Patroni
- 2.8: PGSQL PITR
-
3: Instance
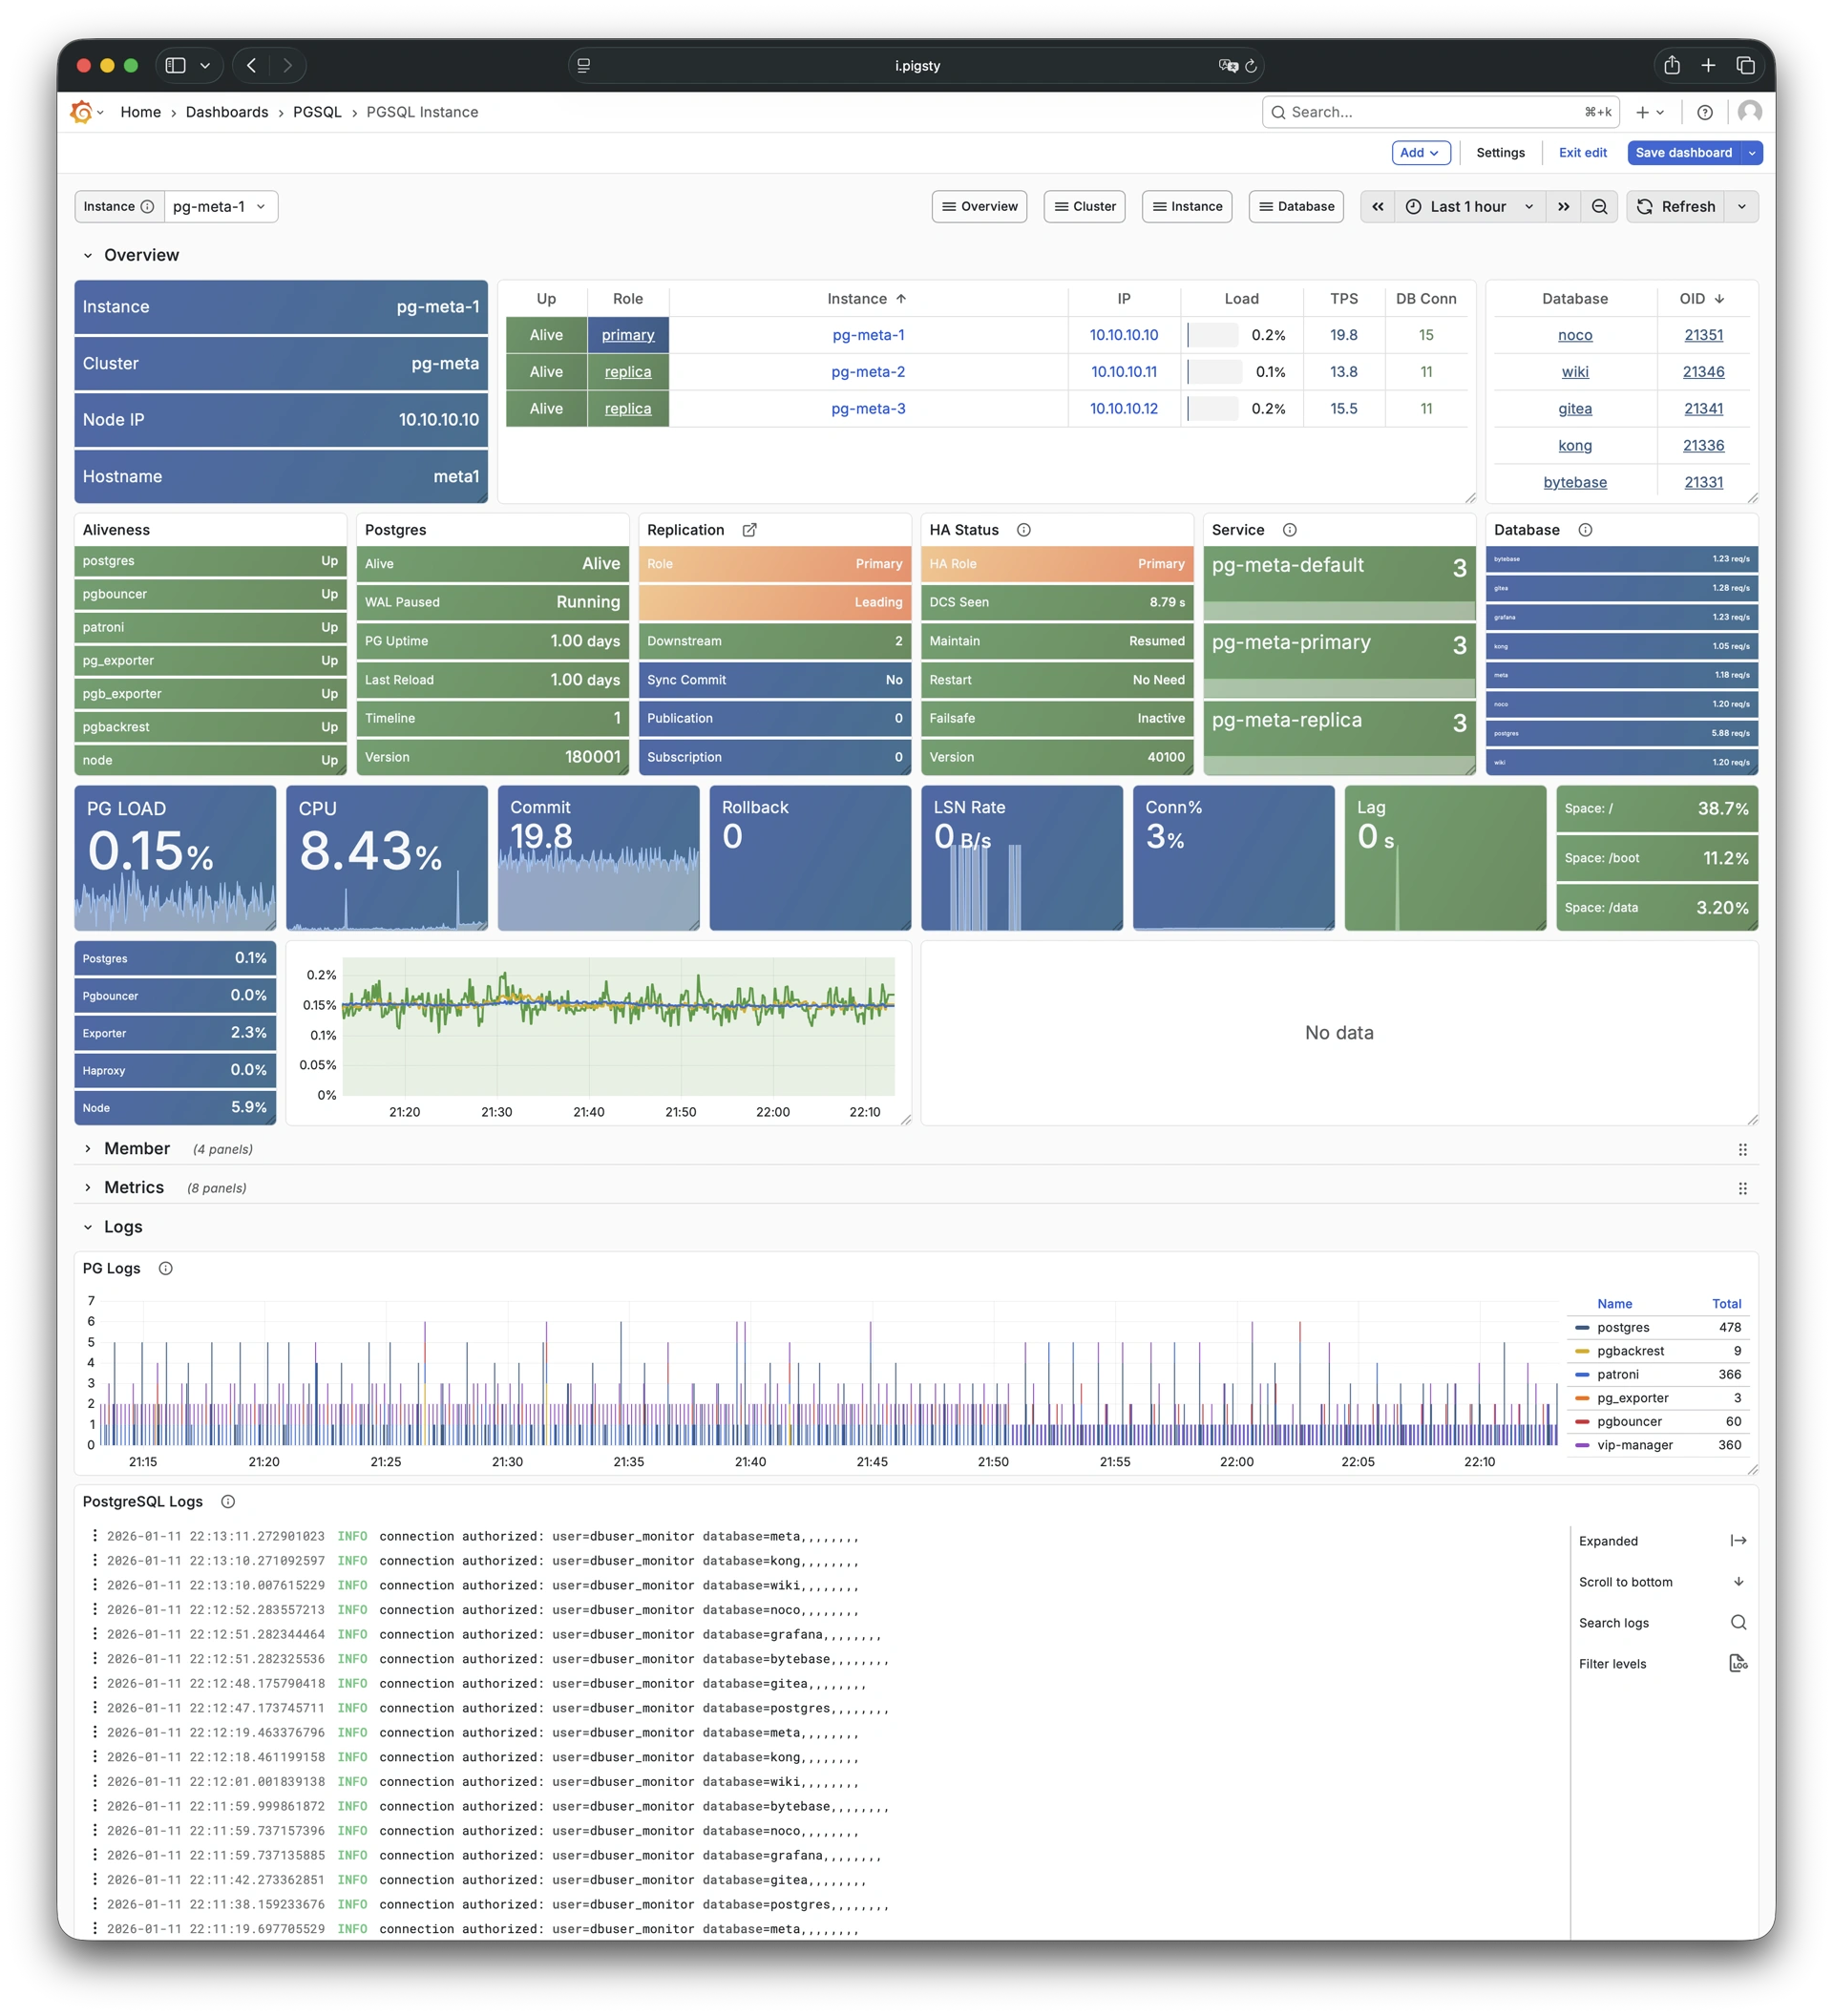
- 3.1: PGSQL Instance
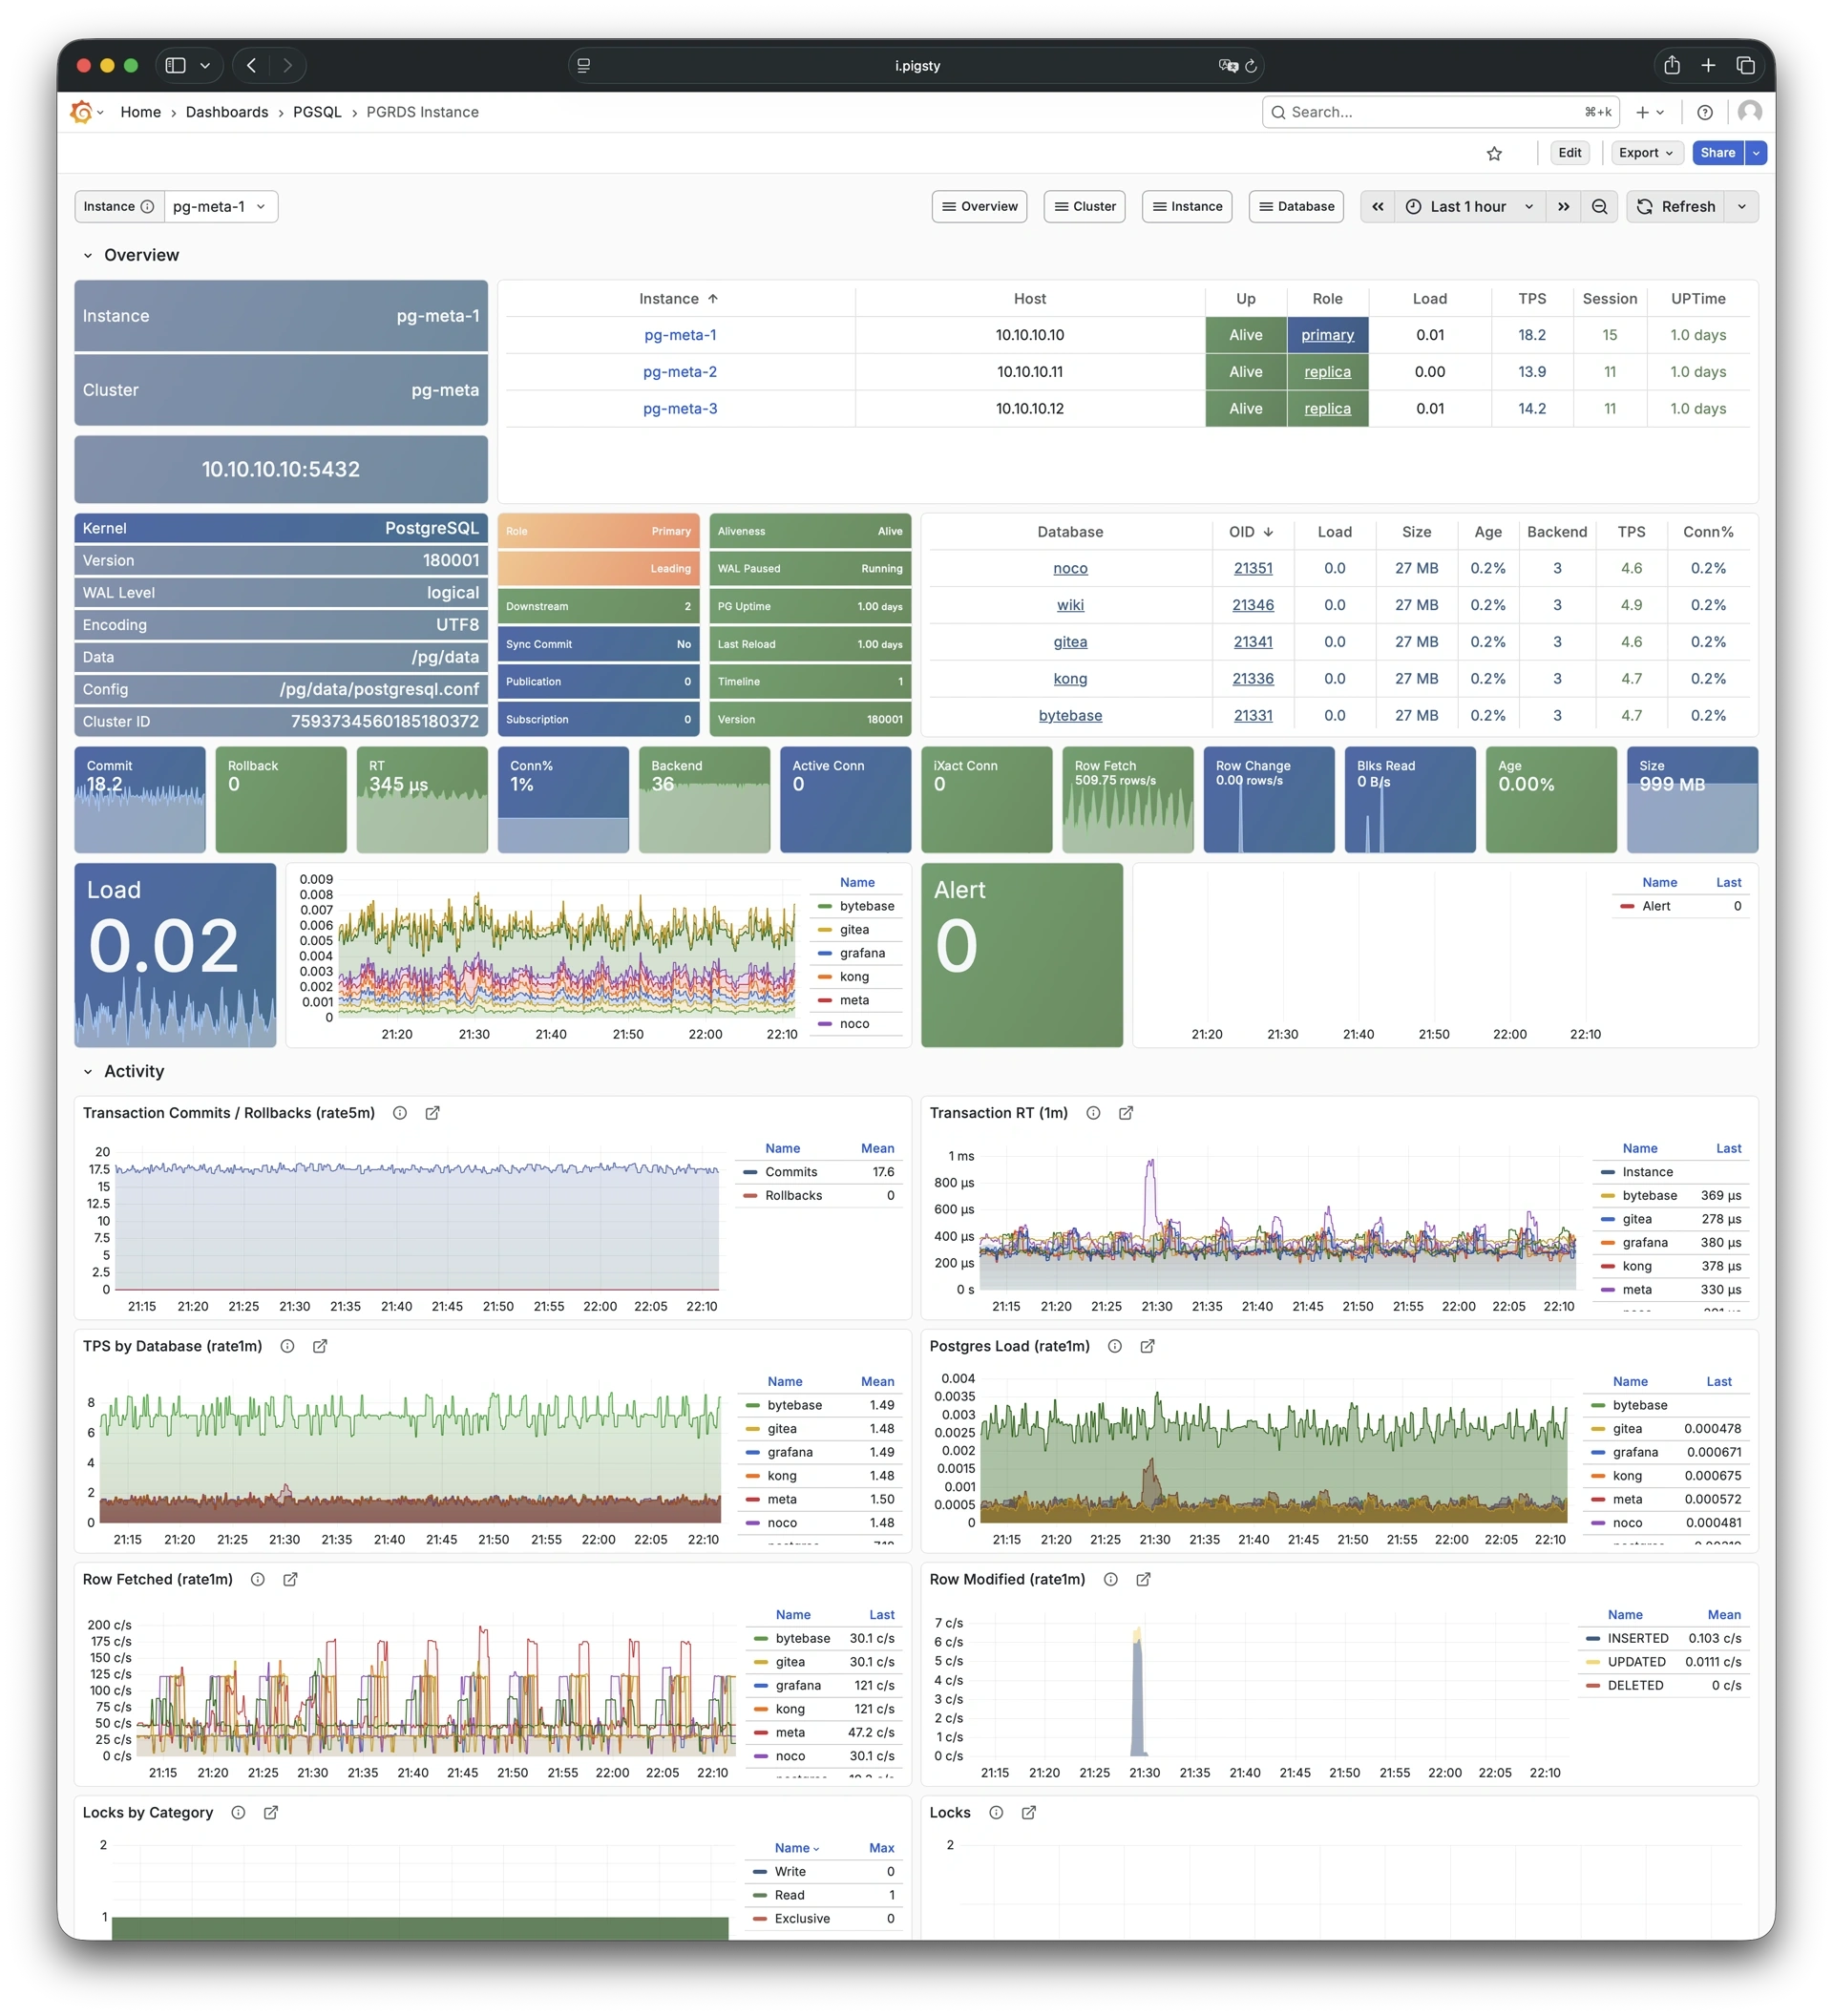
- 3.2: PGRDS Instance
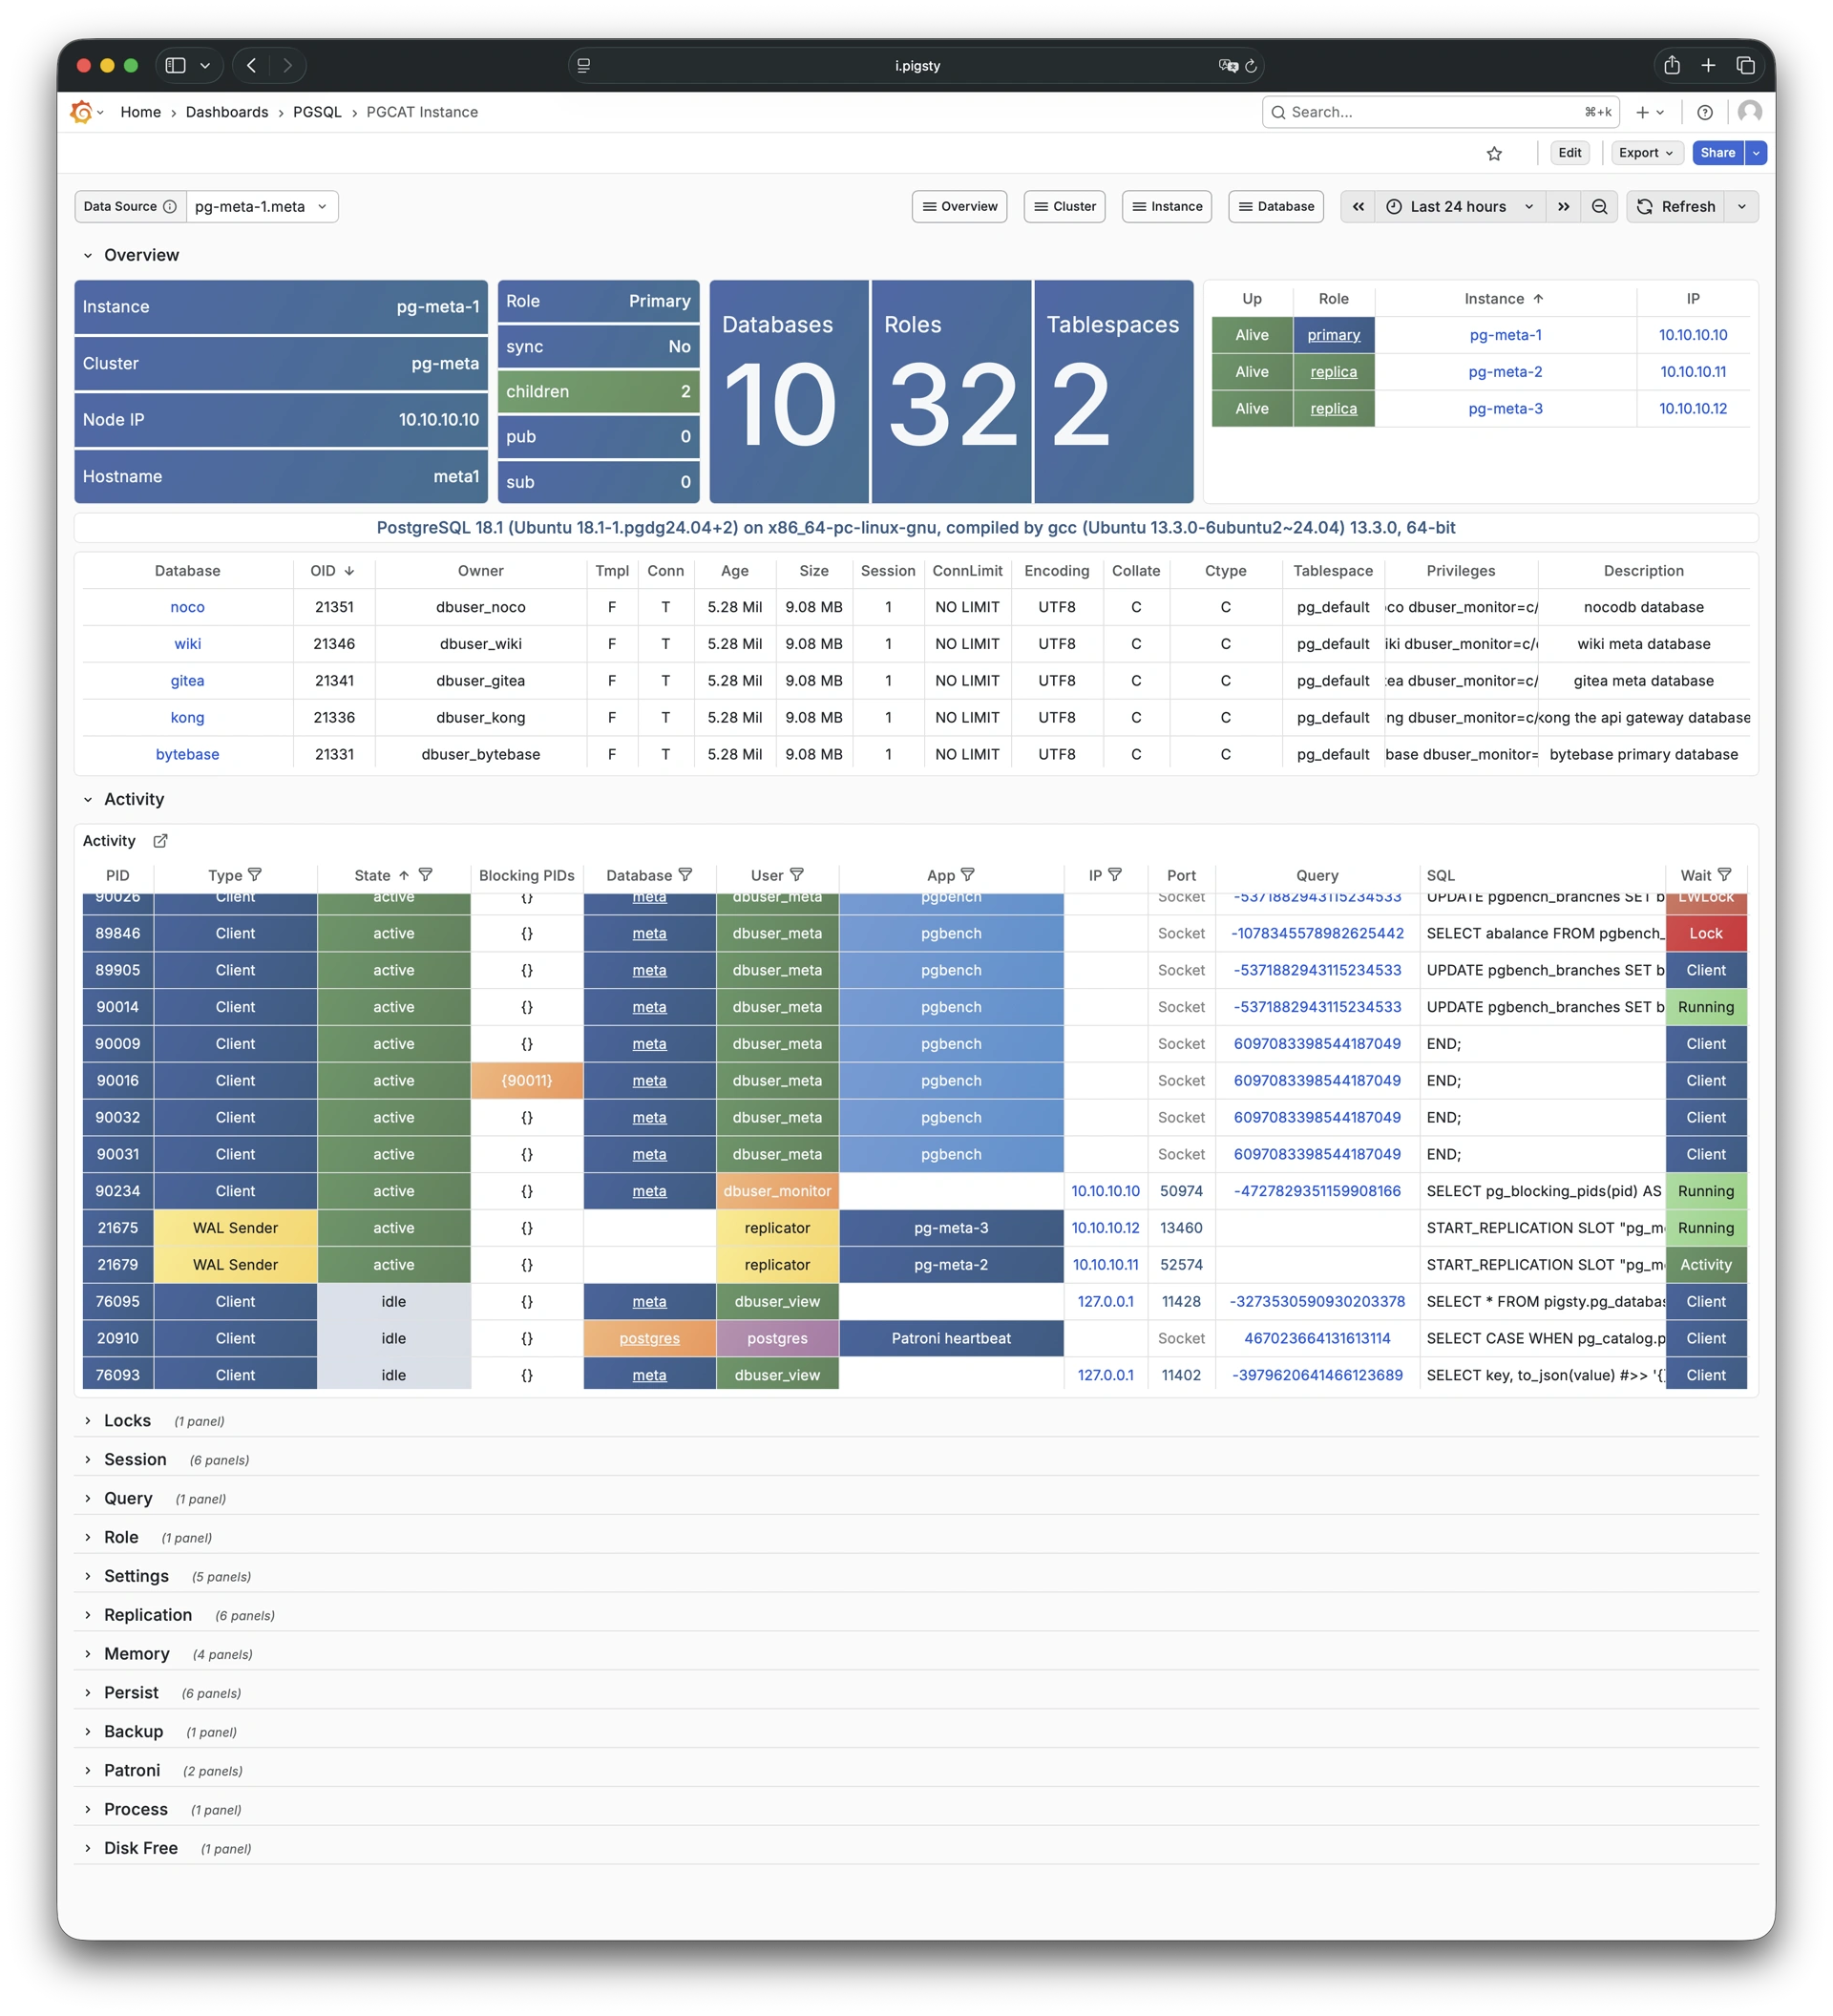
- 3.3: PGCAT Instance
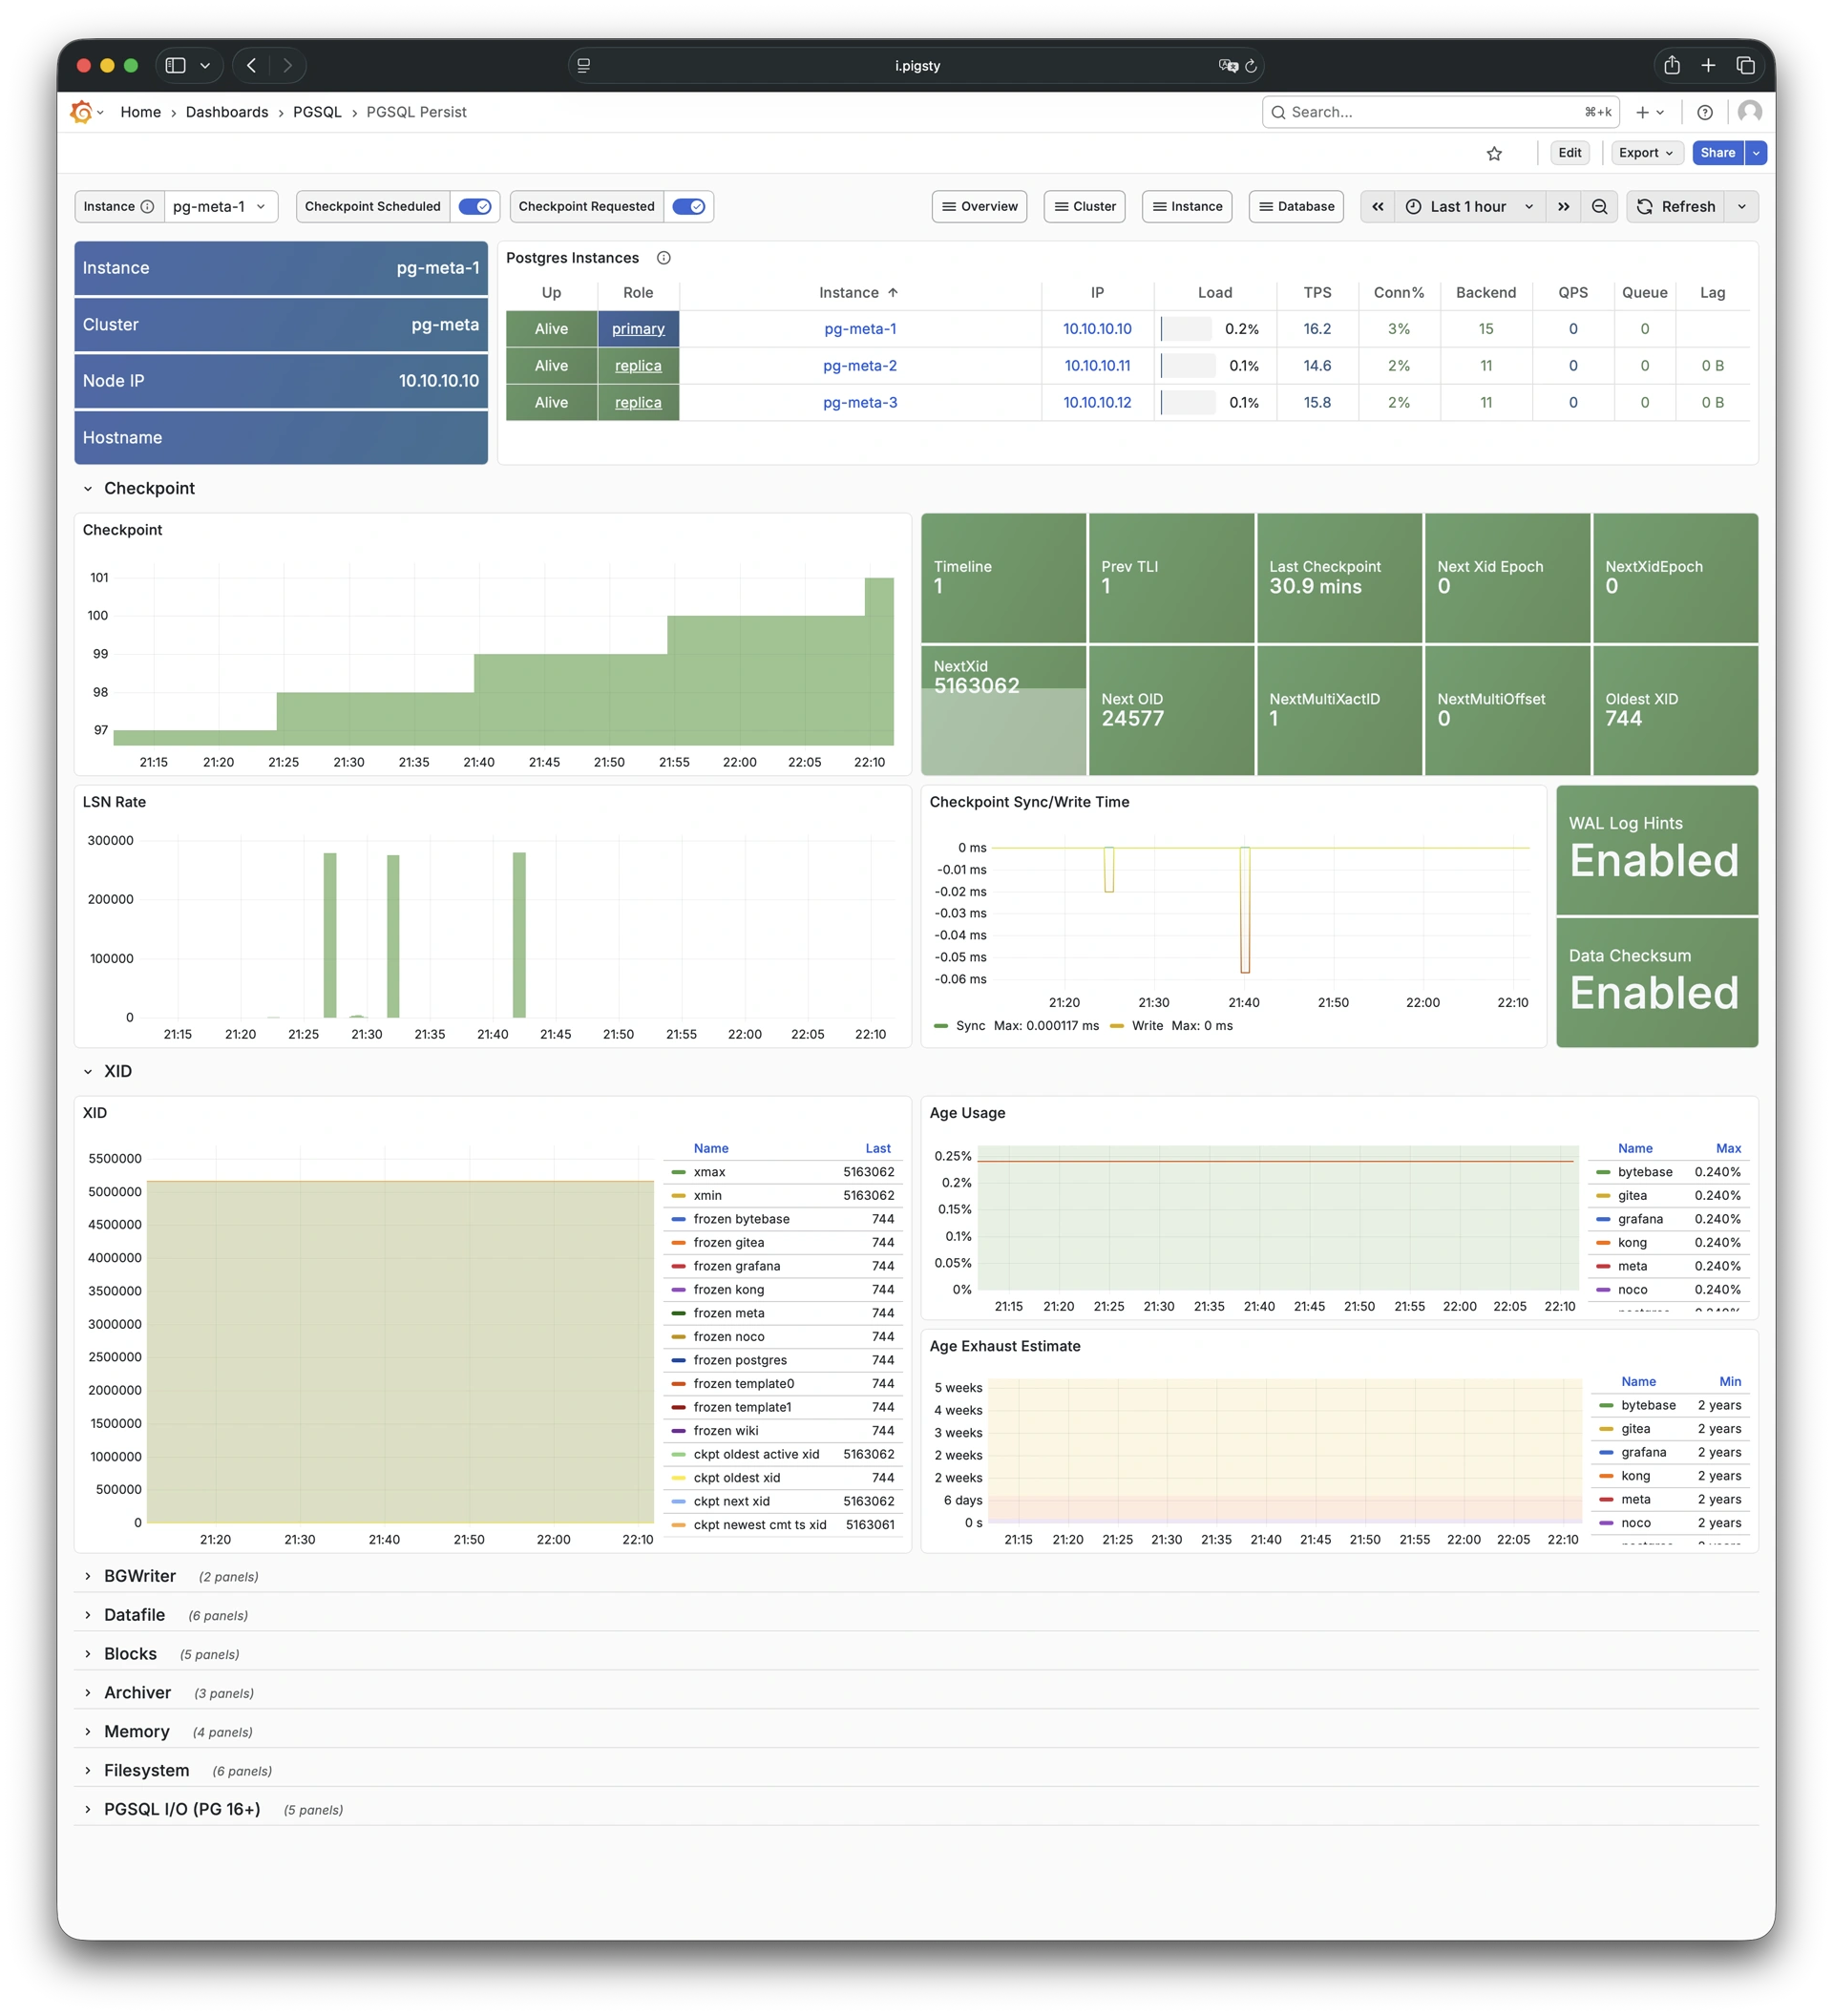
- 3.4: PGSQL Persist
- 3.5: PGSQL Proxy
- 3.6: PGSQL Pgbouncer
- 3.7: PGSQL Session
- 3.8: PGSQL Xacts
- 3.9: PGSQL Exporter
-
4: Database
- 4.1: PGSQL Database
- 4.2: PGCAT Database
- 4.3: PGSQL Tables
- 4.4: PGSQL Table
- 4.5: PGCAT Table
- 4.6: PGSQL Query
- 4.7: PGCAT Query
- 4.8: PGCAT Locks
- 4.9: PGCAT Schema
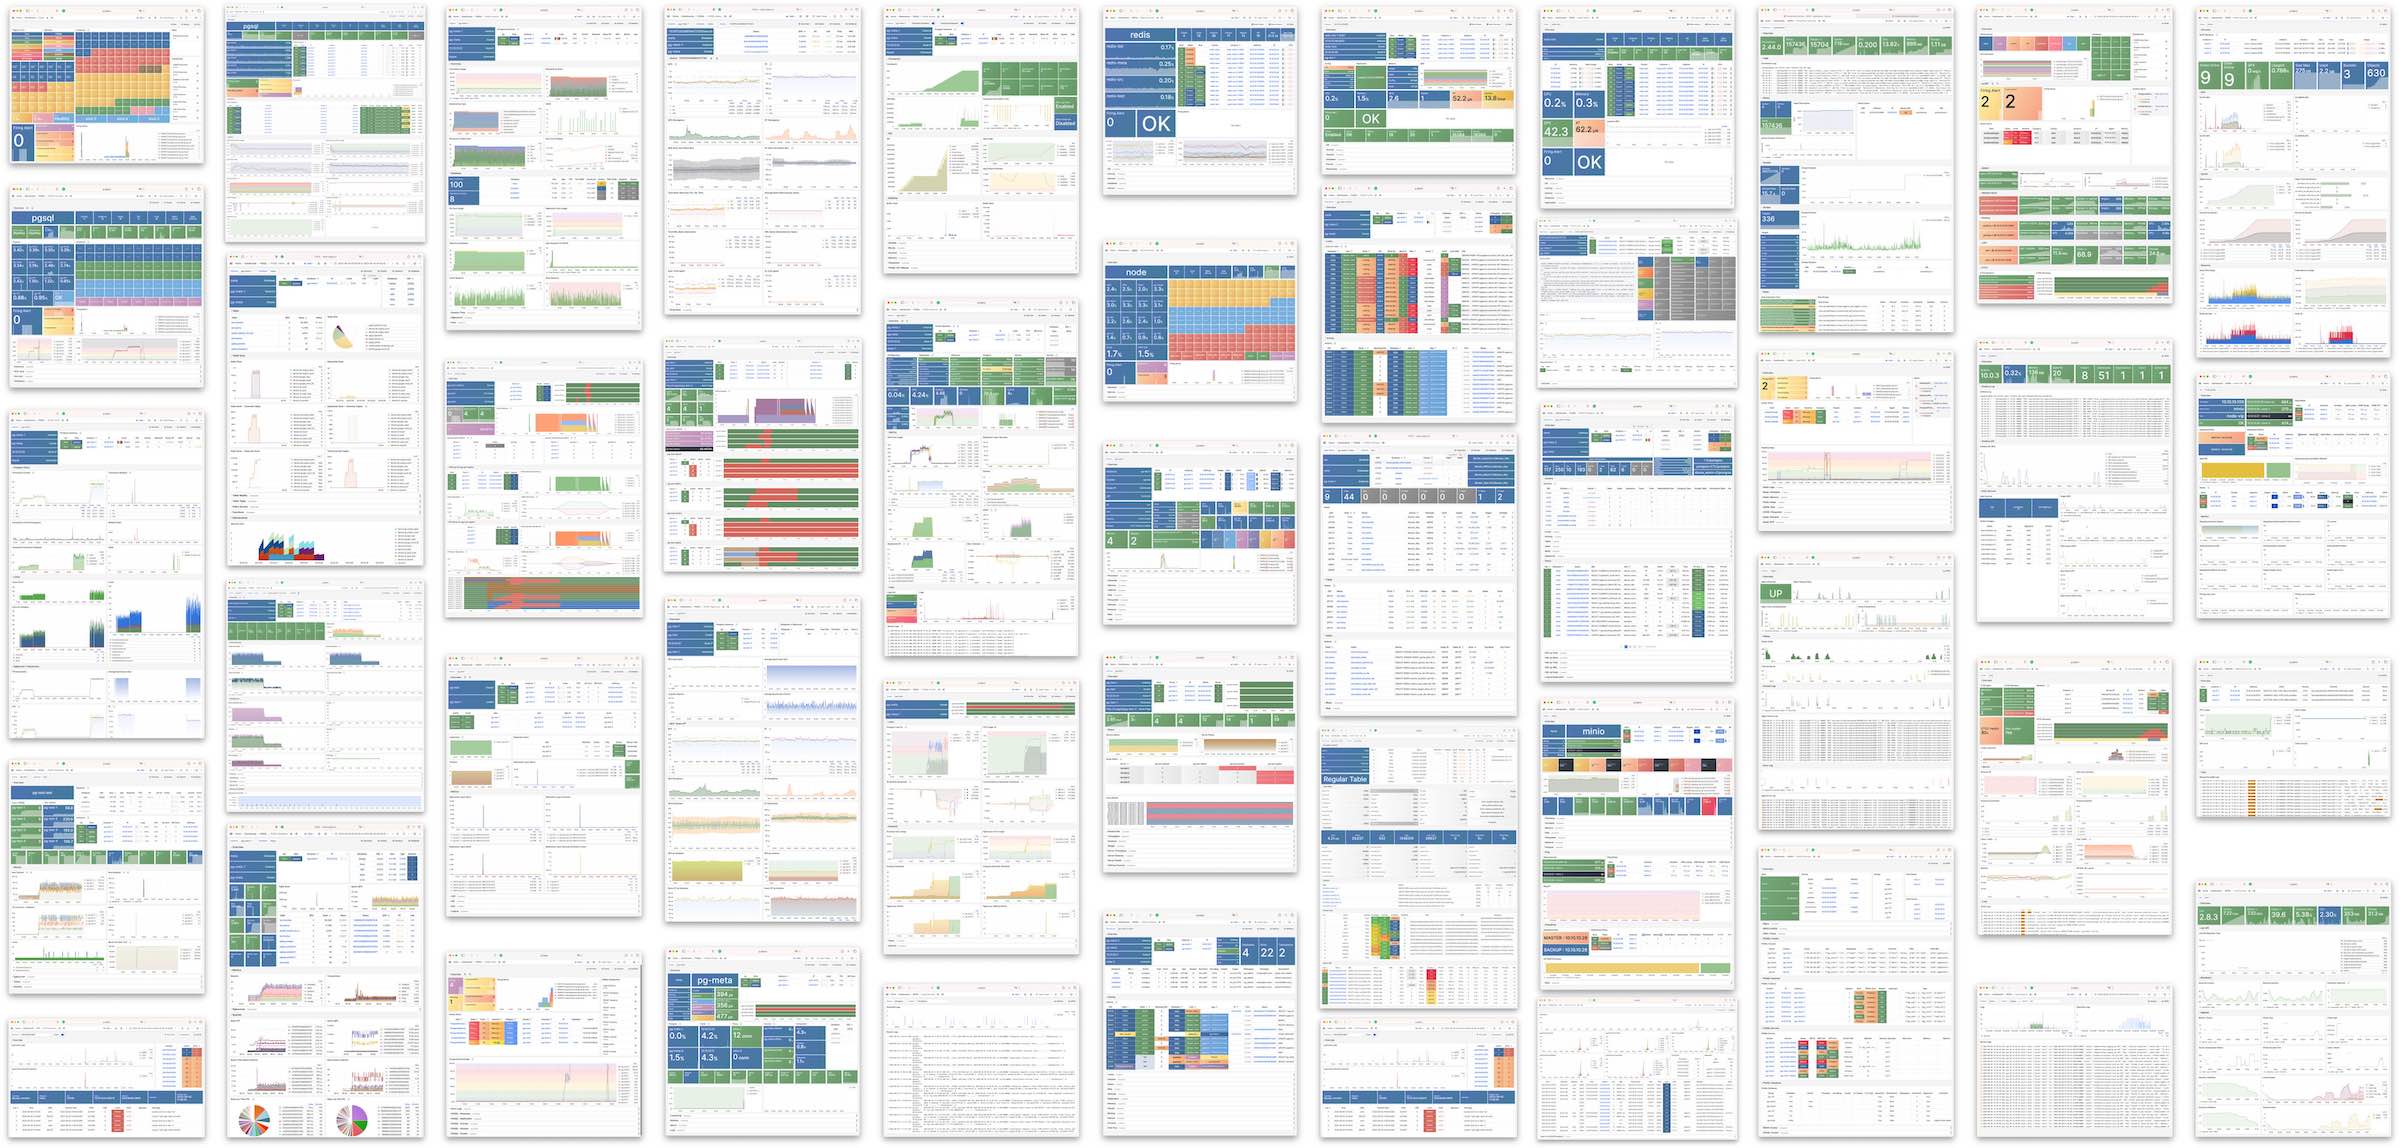
Pigsty provides numerous out-of-the-box Grafana monitoring dashboards for PostgreSQL: Demo & Gallery.
The current source provides 31 PostgreSQL-related dashboards: 29 PostgreSQL / PGCAT dashboards under files/grafana/pgsql, plus two PGLOG dashboards under files/grafana/app. They are organized by hierarchy into Overview, Cluster, Instance, and Database categories, and by data source into PGSQL, PGCAT, and PGLOG.
Overview
Overview
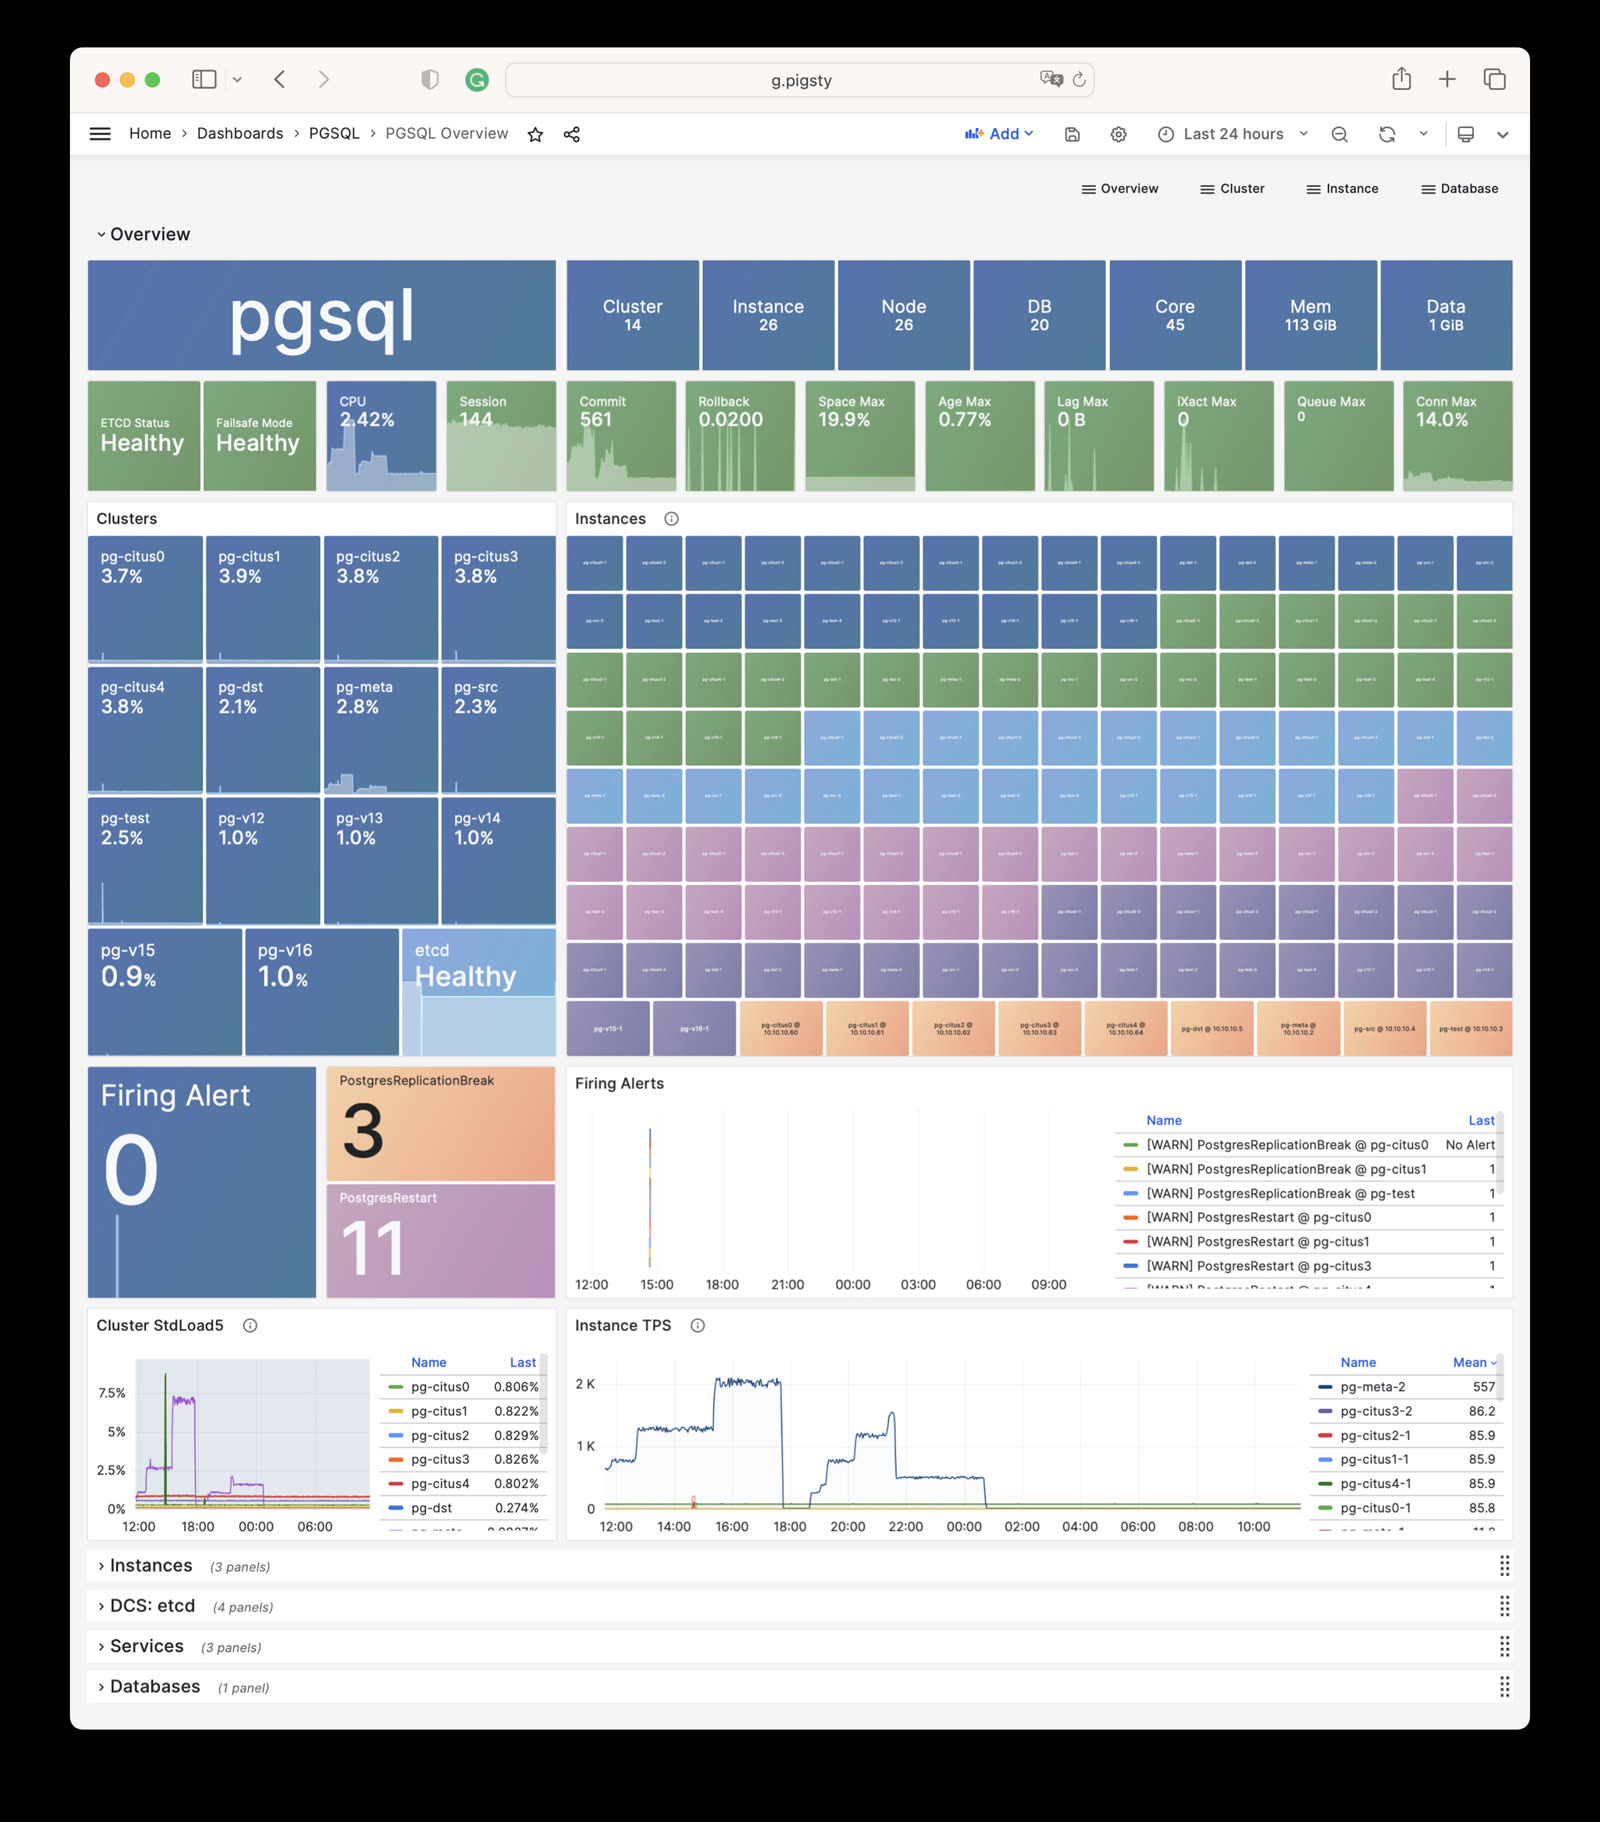
- pgsql-overview: Main dashboard for the PGSQL module
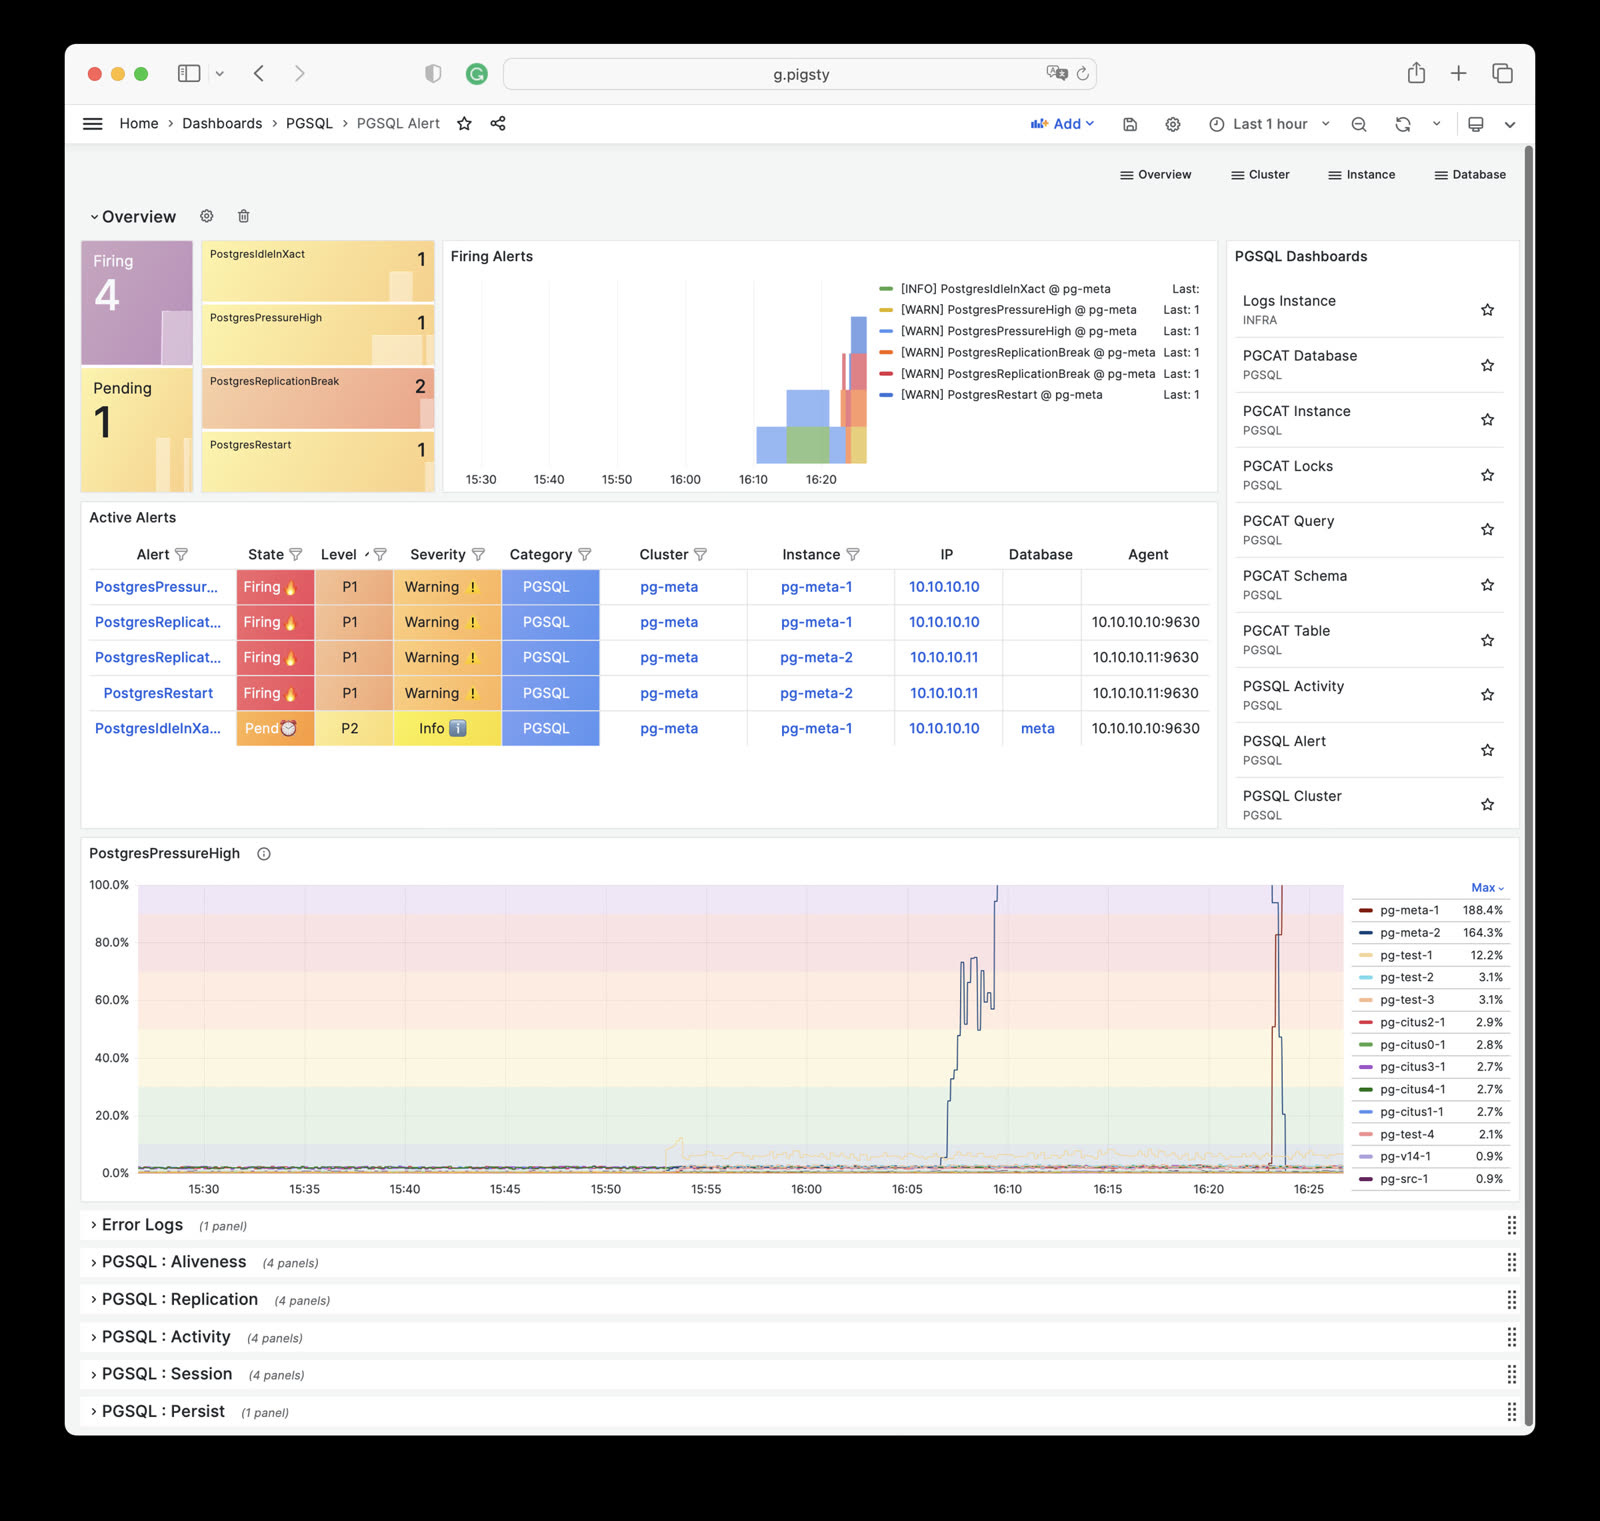
- pgsql-alert: Global key metrics and alert events for PGSQL
- pgsql-shard: Overview of horizontally sharded PGSQL clusters (e.g., Citus/GPSQL)
Cluster
- pgsql-cluster: Main dashboard for a PGSQL cluster
- pgrds-cluster: RDS version of PGSQL Cluster, focusing on PostgreSQL-native metrics
- pgsql-activity: Session/load/QPS/TPS/locks for PGSQL cluster
- pgsql-replication: Replication, slots, and pub/sub for PGSQL cluster
- pgsql-service: Service, proxy, routing, and load balancing for PGSQL cluster
- pgsql-databases: Database CRUD, slow queries, and table statistics across all instances
- pgsql-patroni: HA status and Patroni component status for cluster
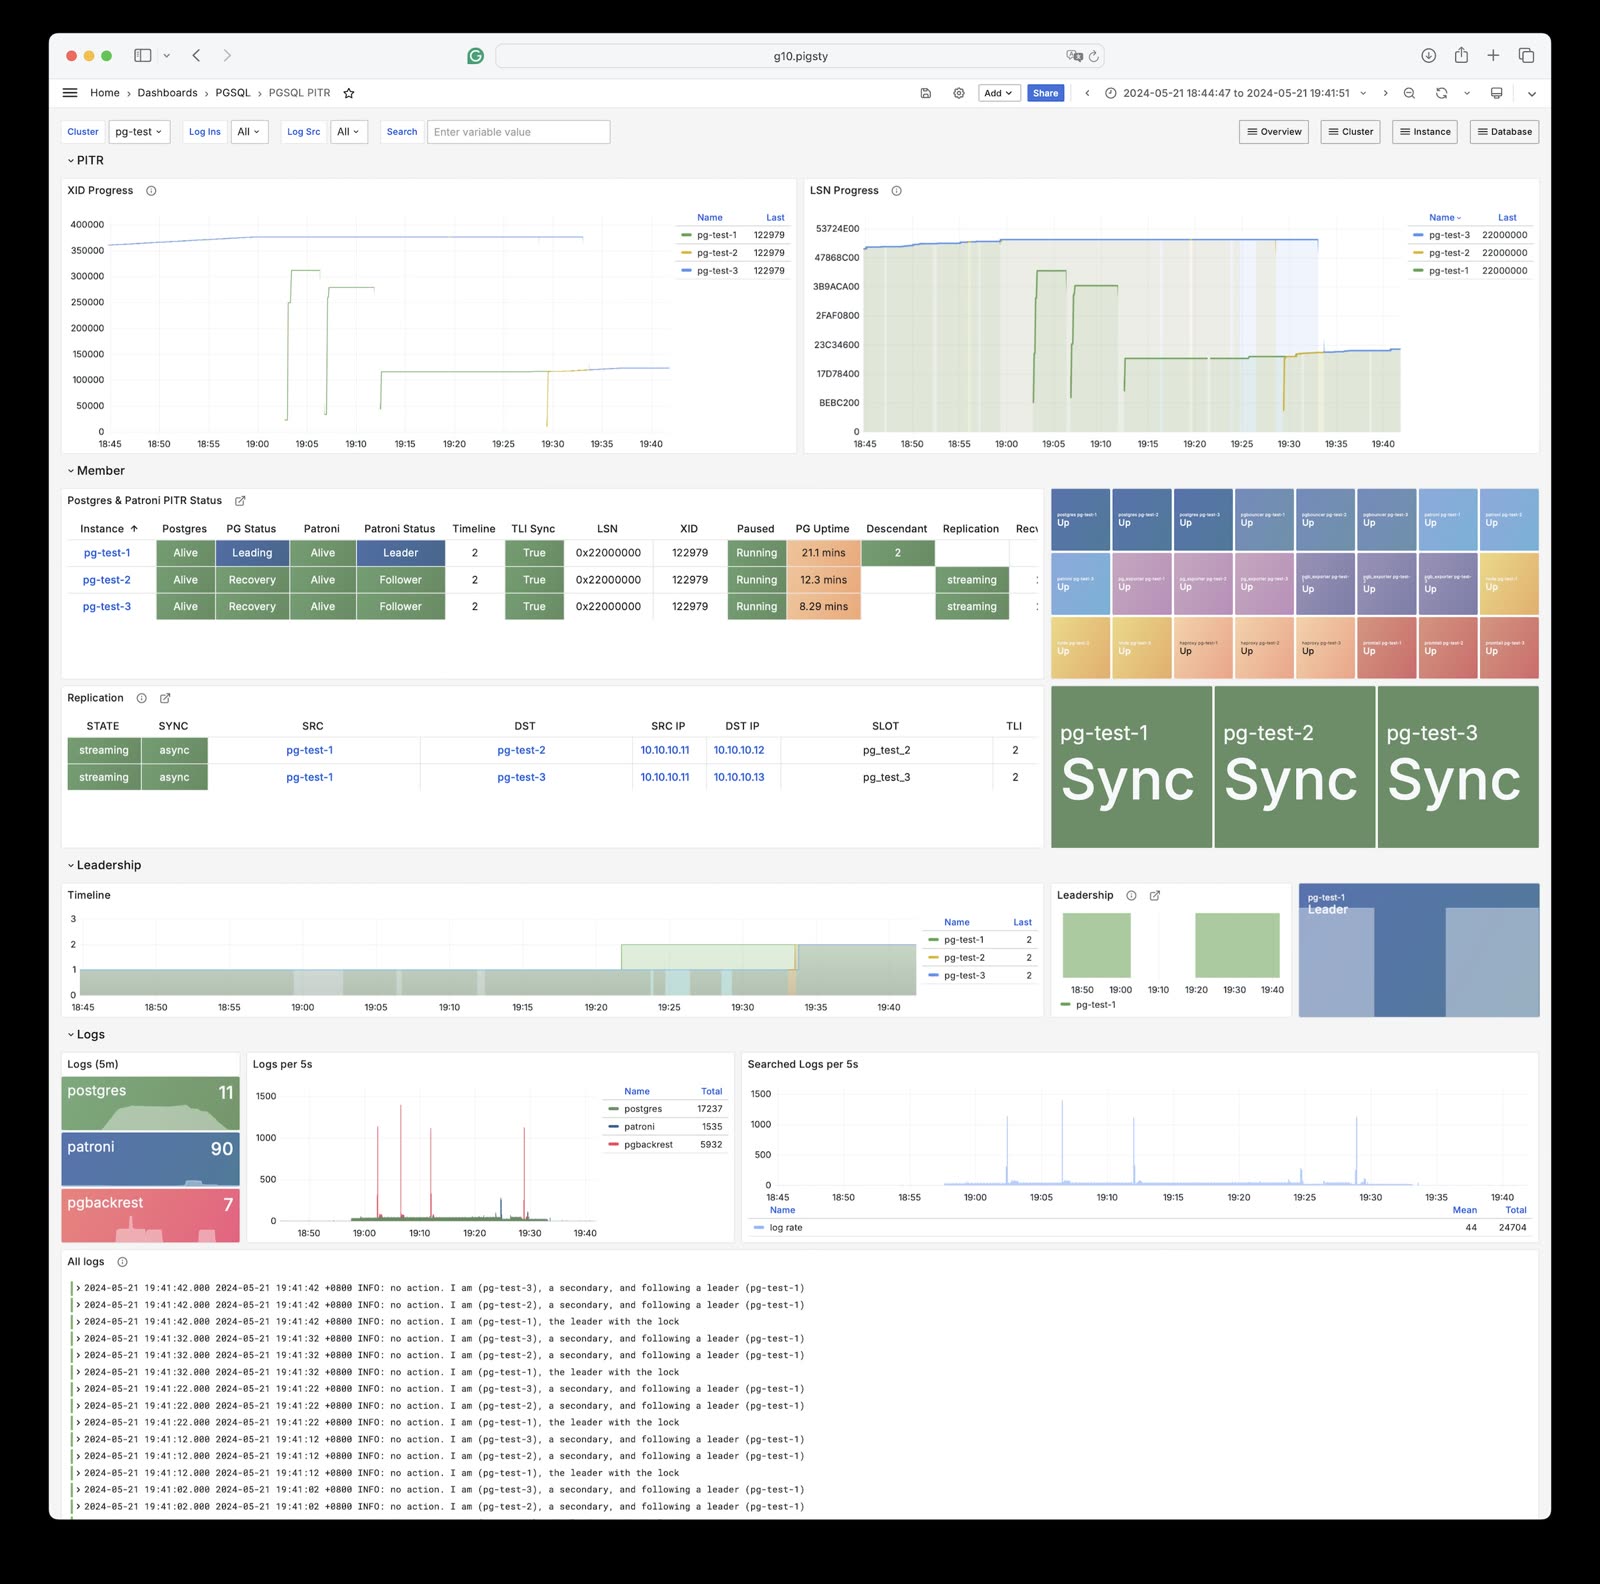
- pgsql-pitr: PITR context for point-in-time recovery assistance
Instance
- pgsql-instance: Main dashboard for a single PGSQL instance
- pgrds-instance: RDS version of PGSQL Instance, focusing on PostgreSQL-native metrics
- pgcat-instance: Instance info retrieved directly from database catalog
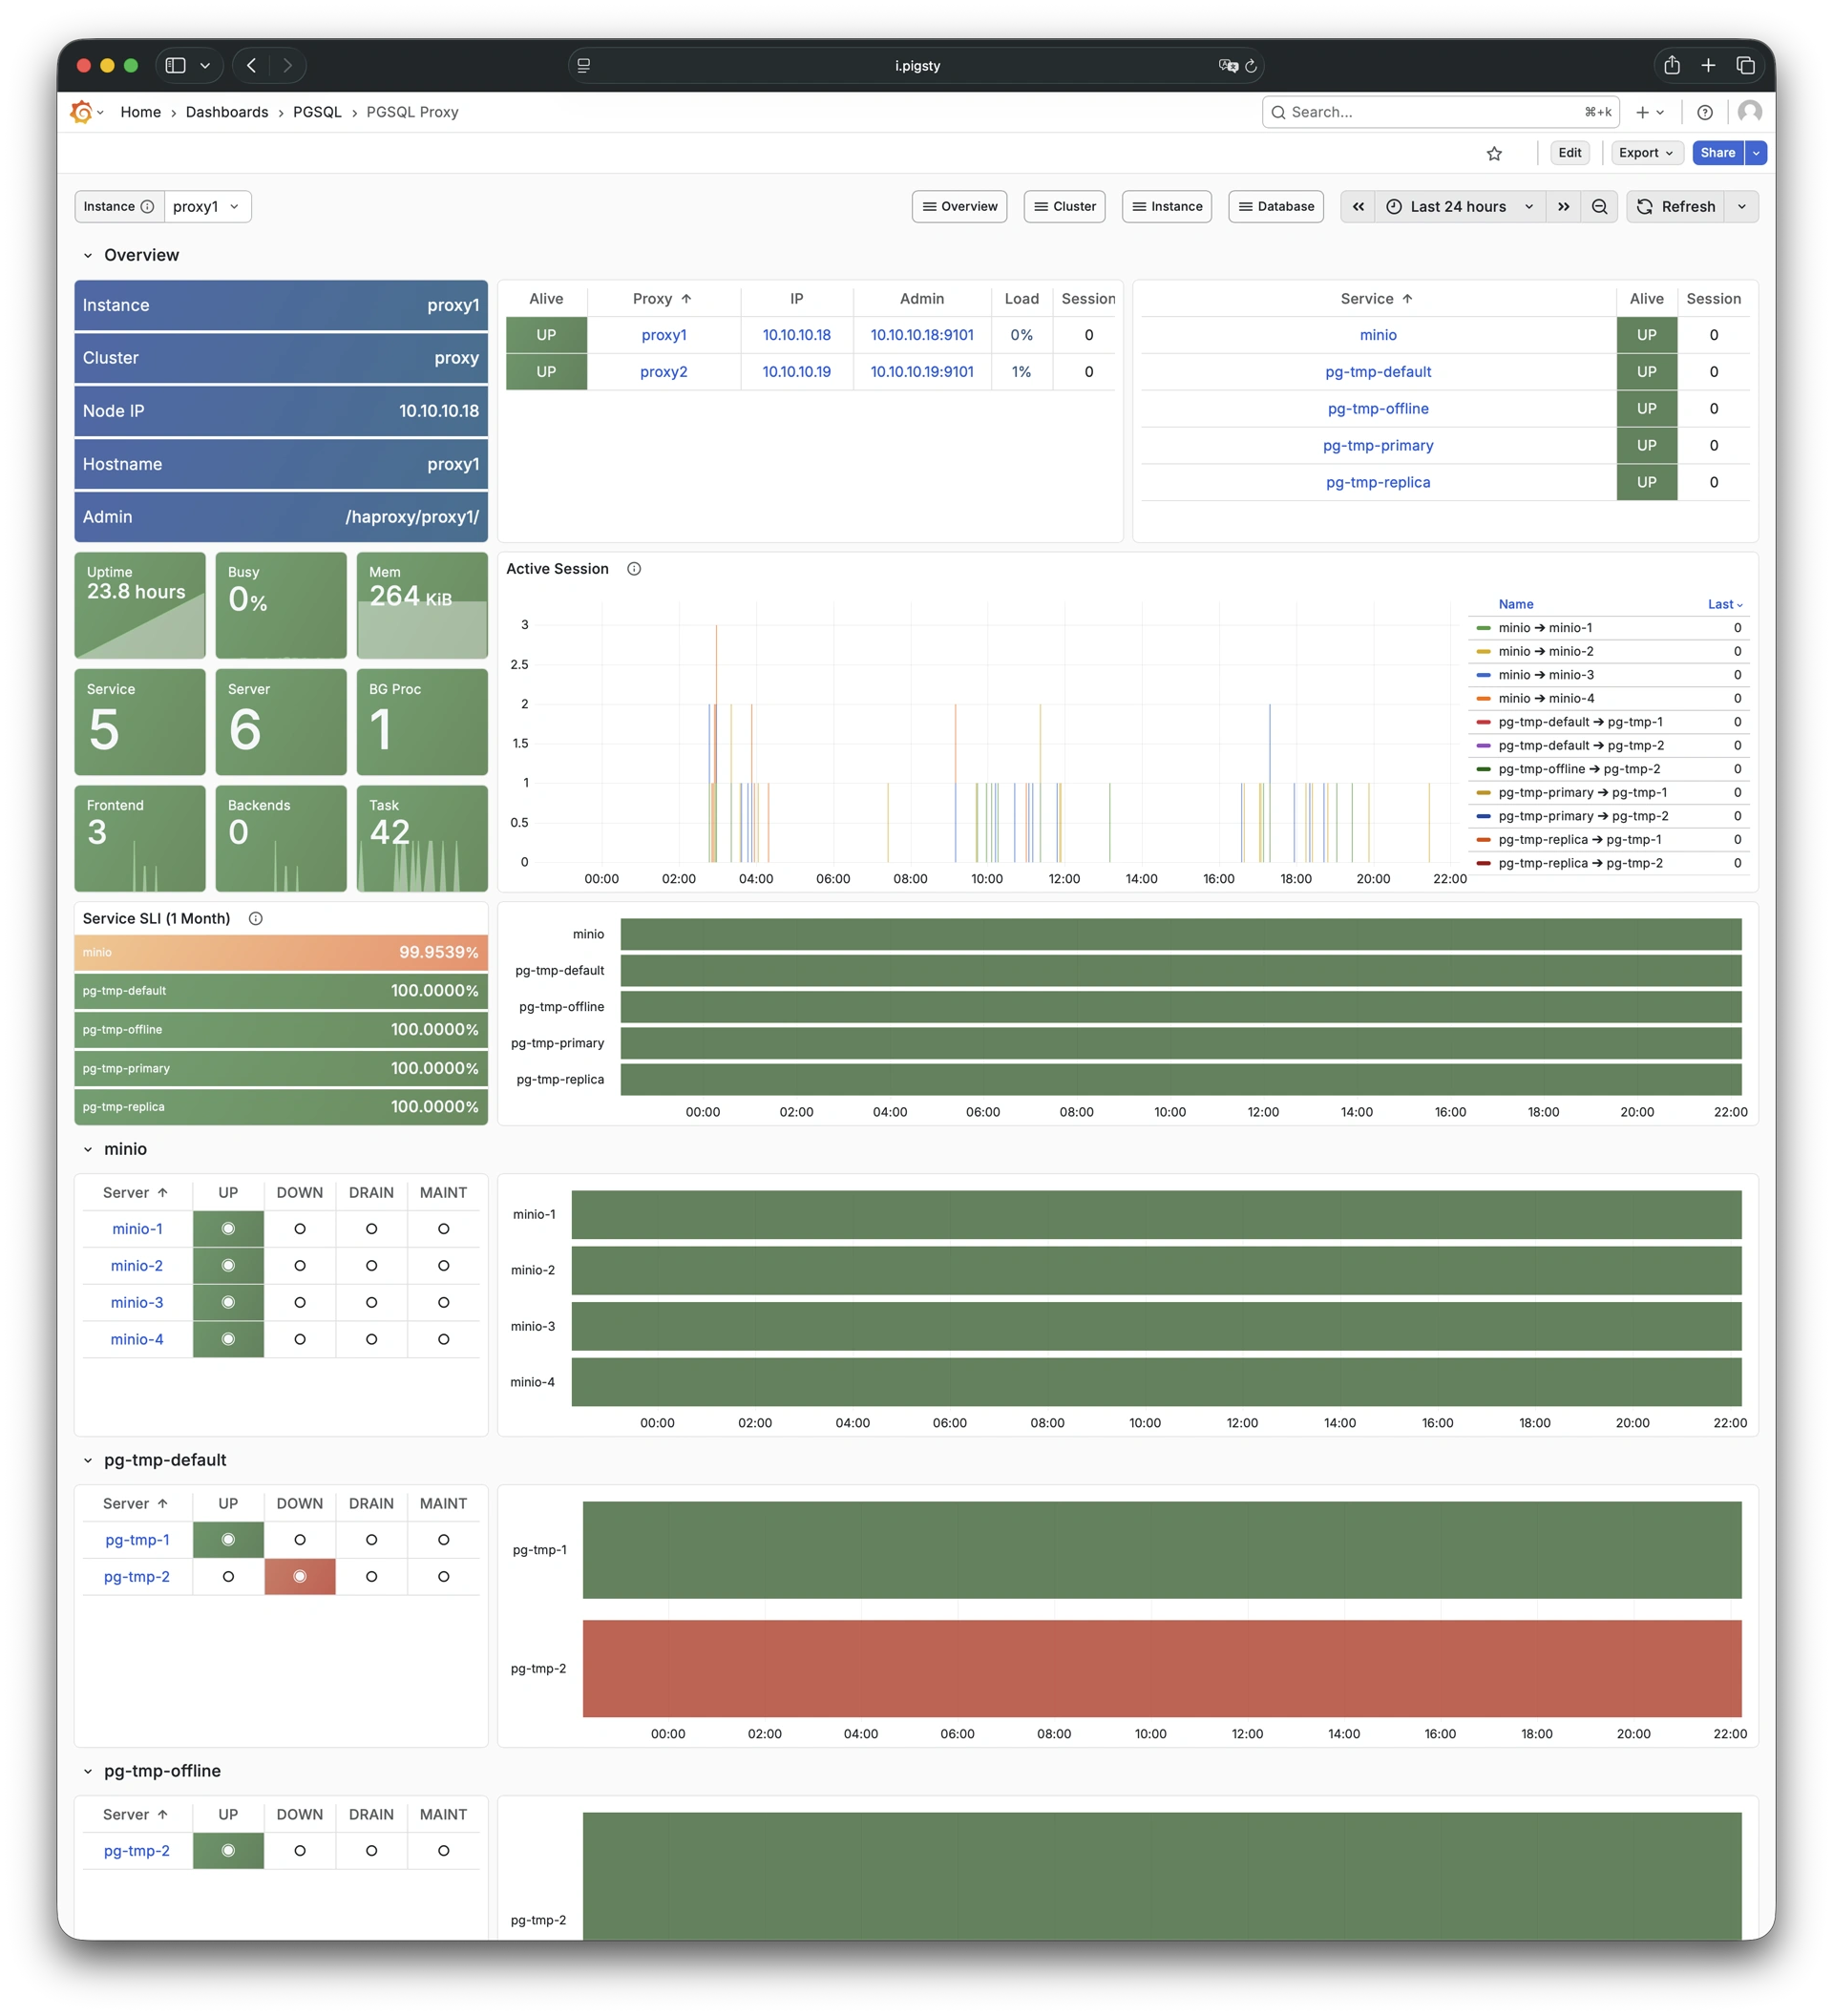
- pgsql-proxy: Detailed metrics for a single HAProxy load balancer
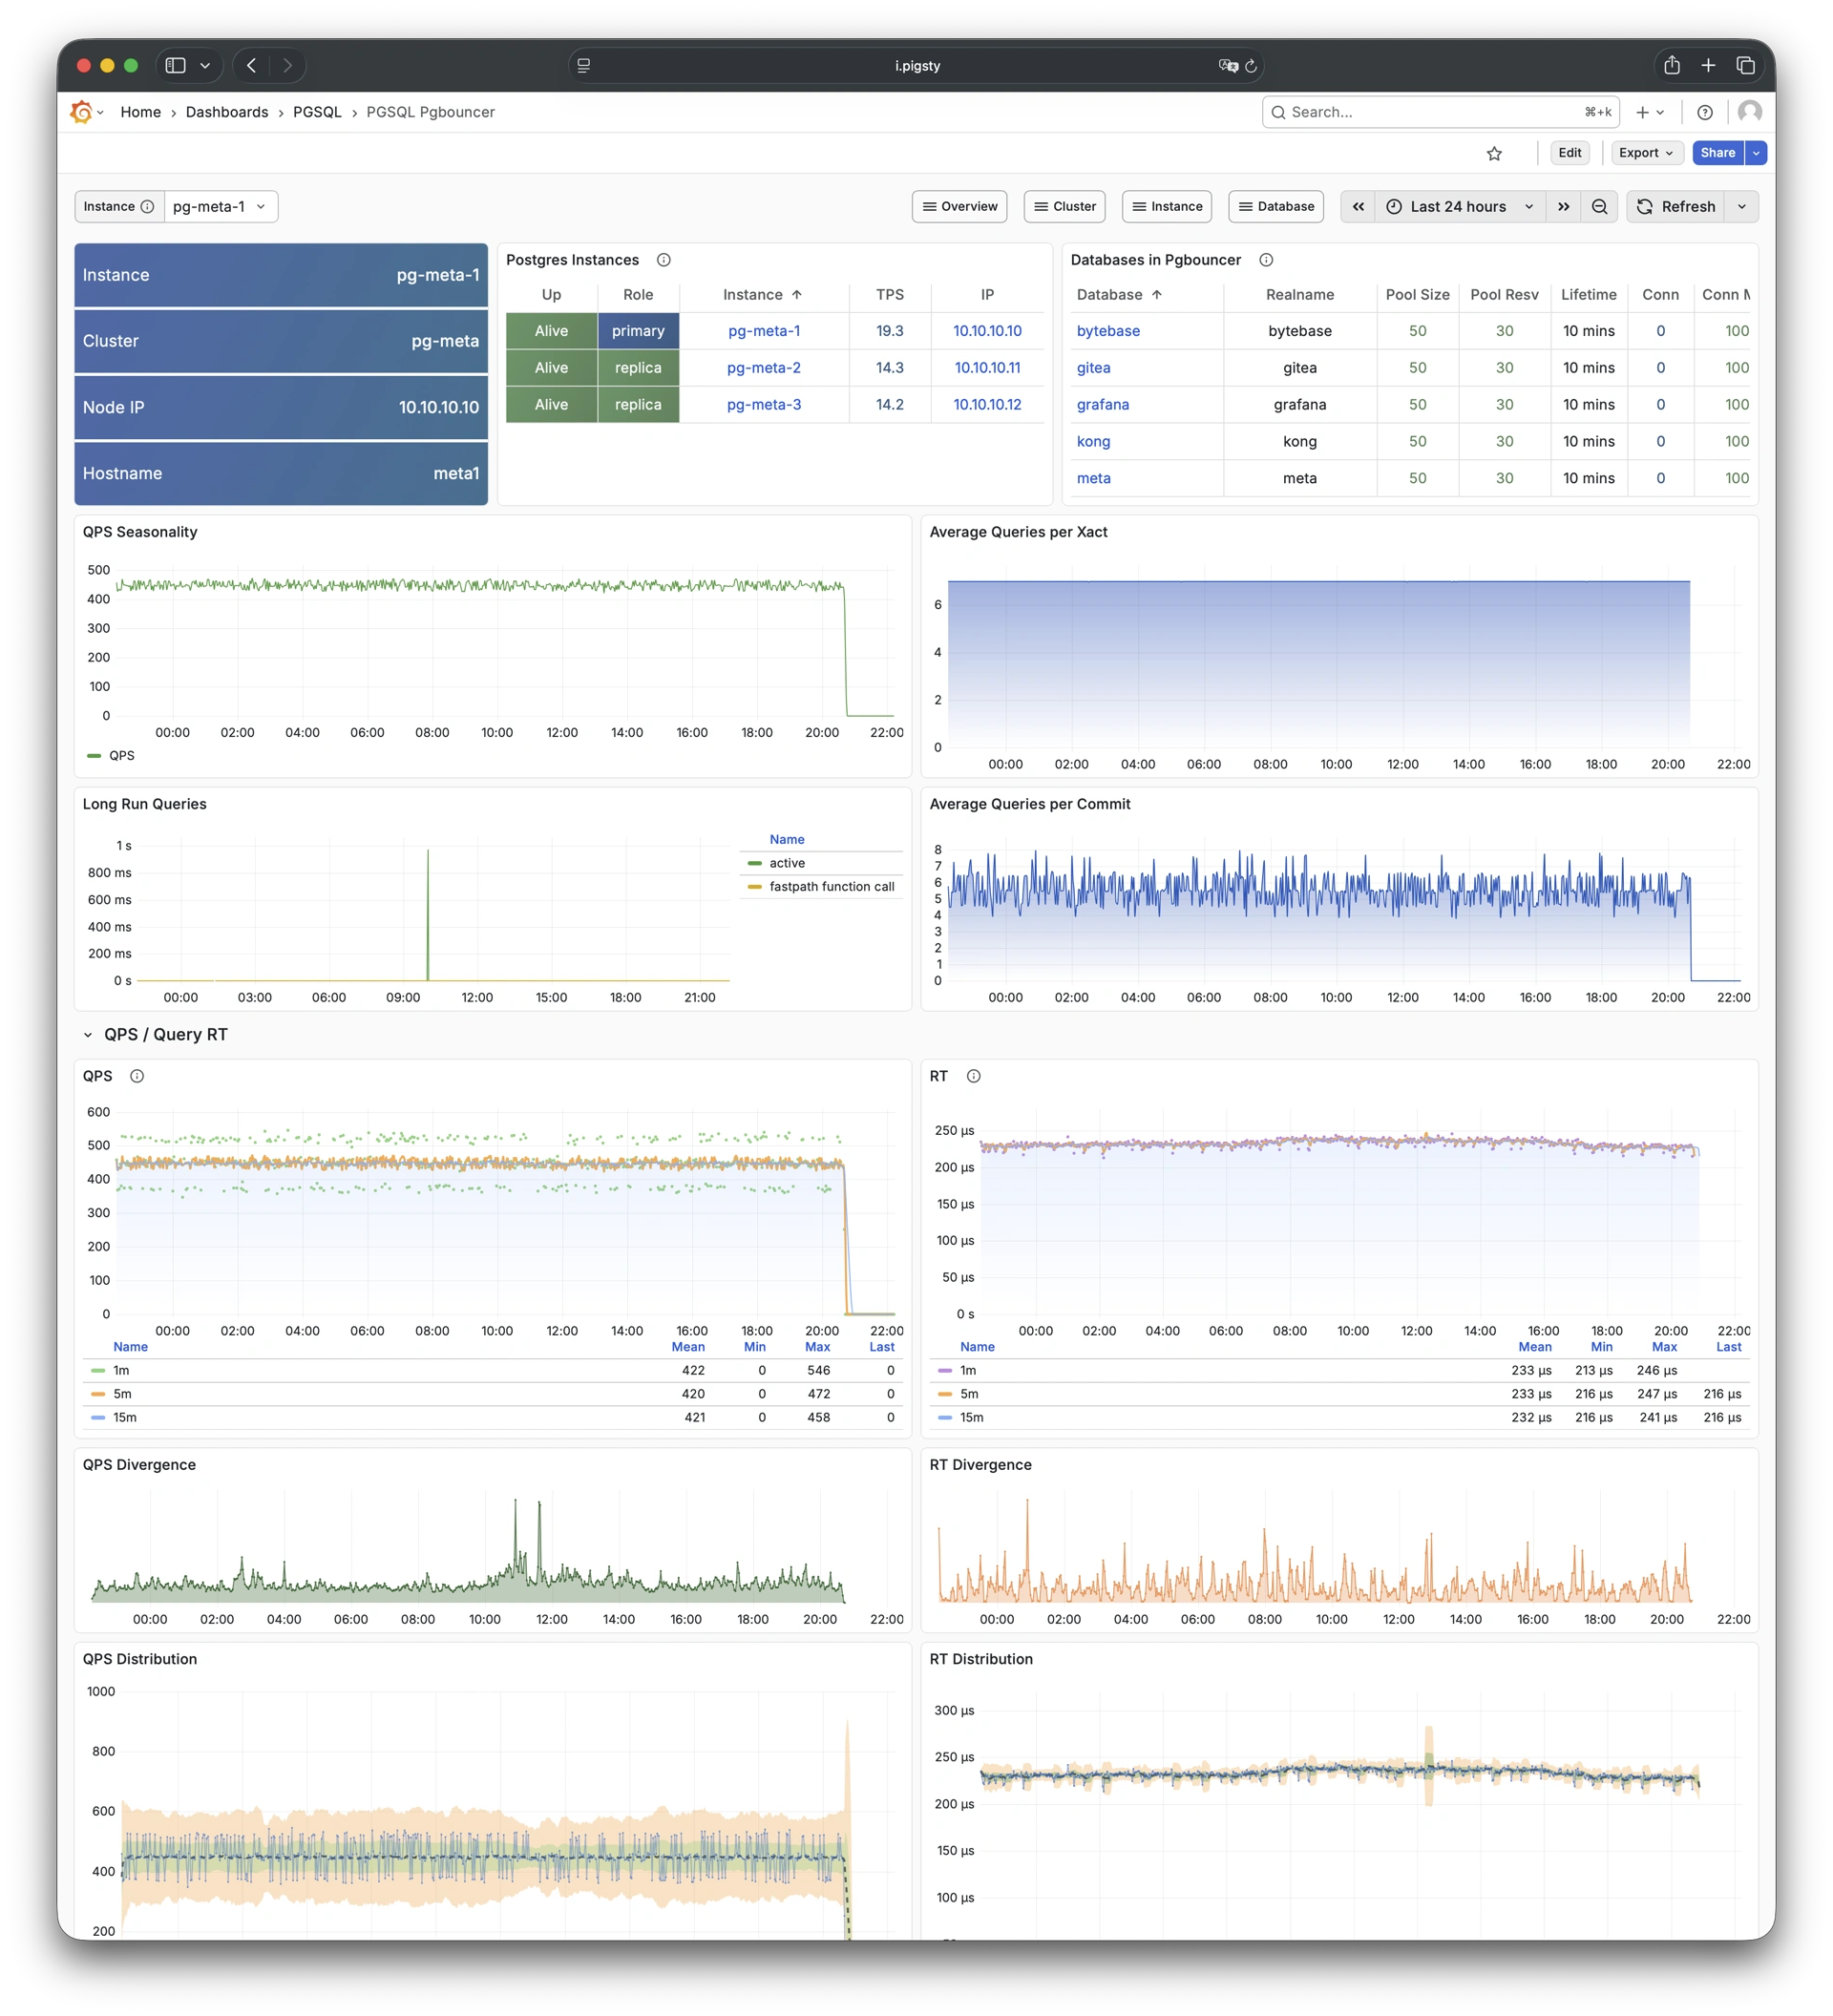
- pgsql-pgbouncer: Metrics overview for a single Pgbouncer connection pooler
- pgsql-persist: Persistence metrics: WAL, XID, checkpoint, archive, IO
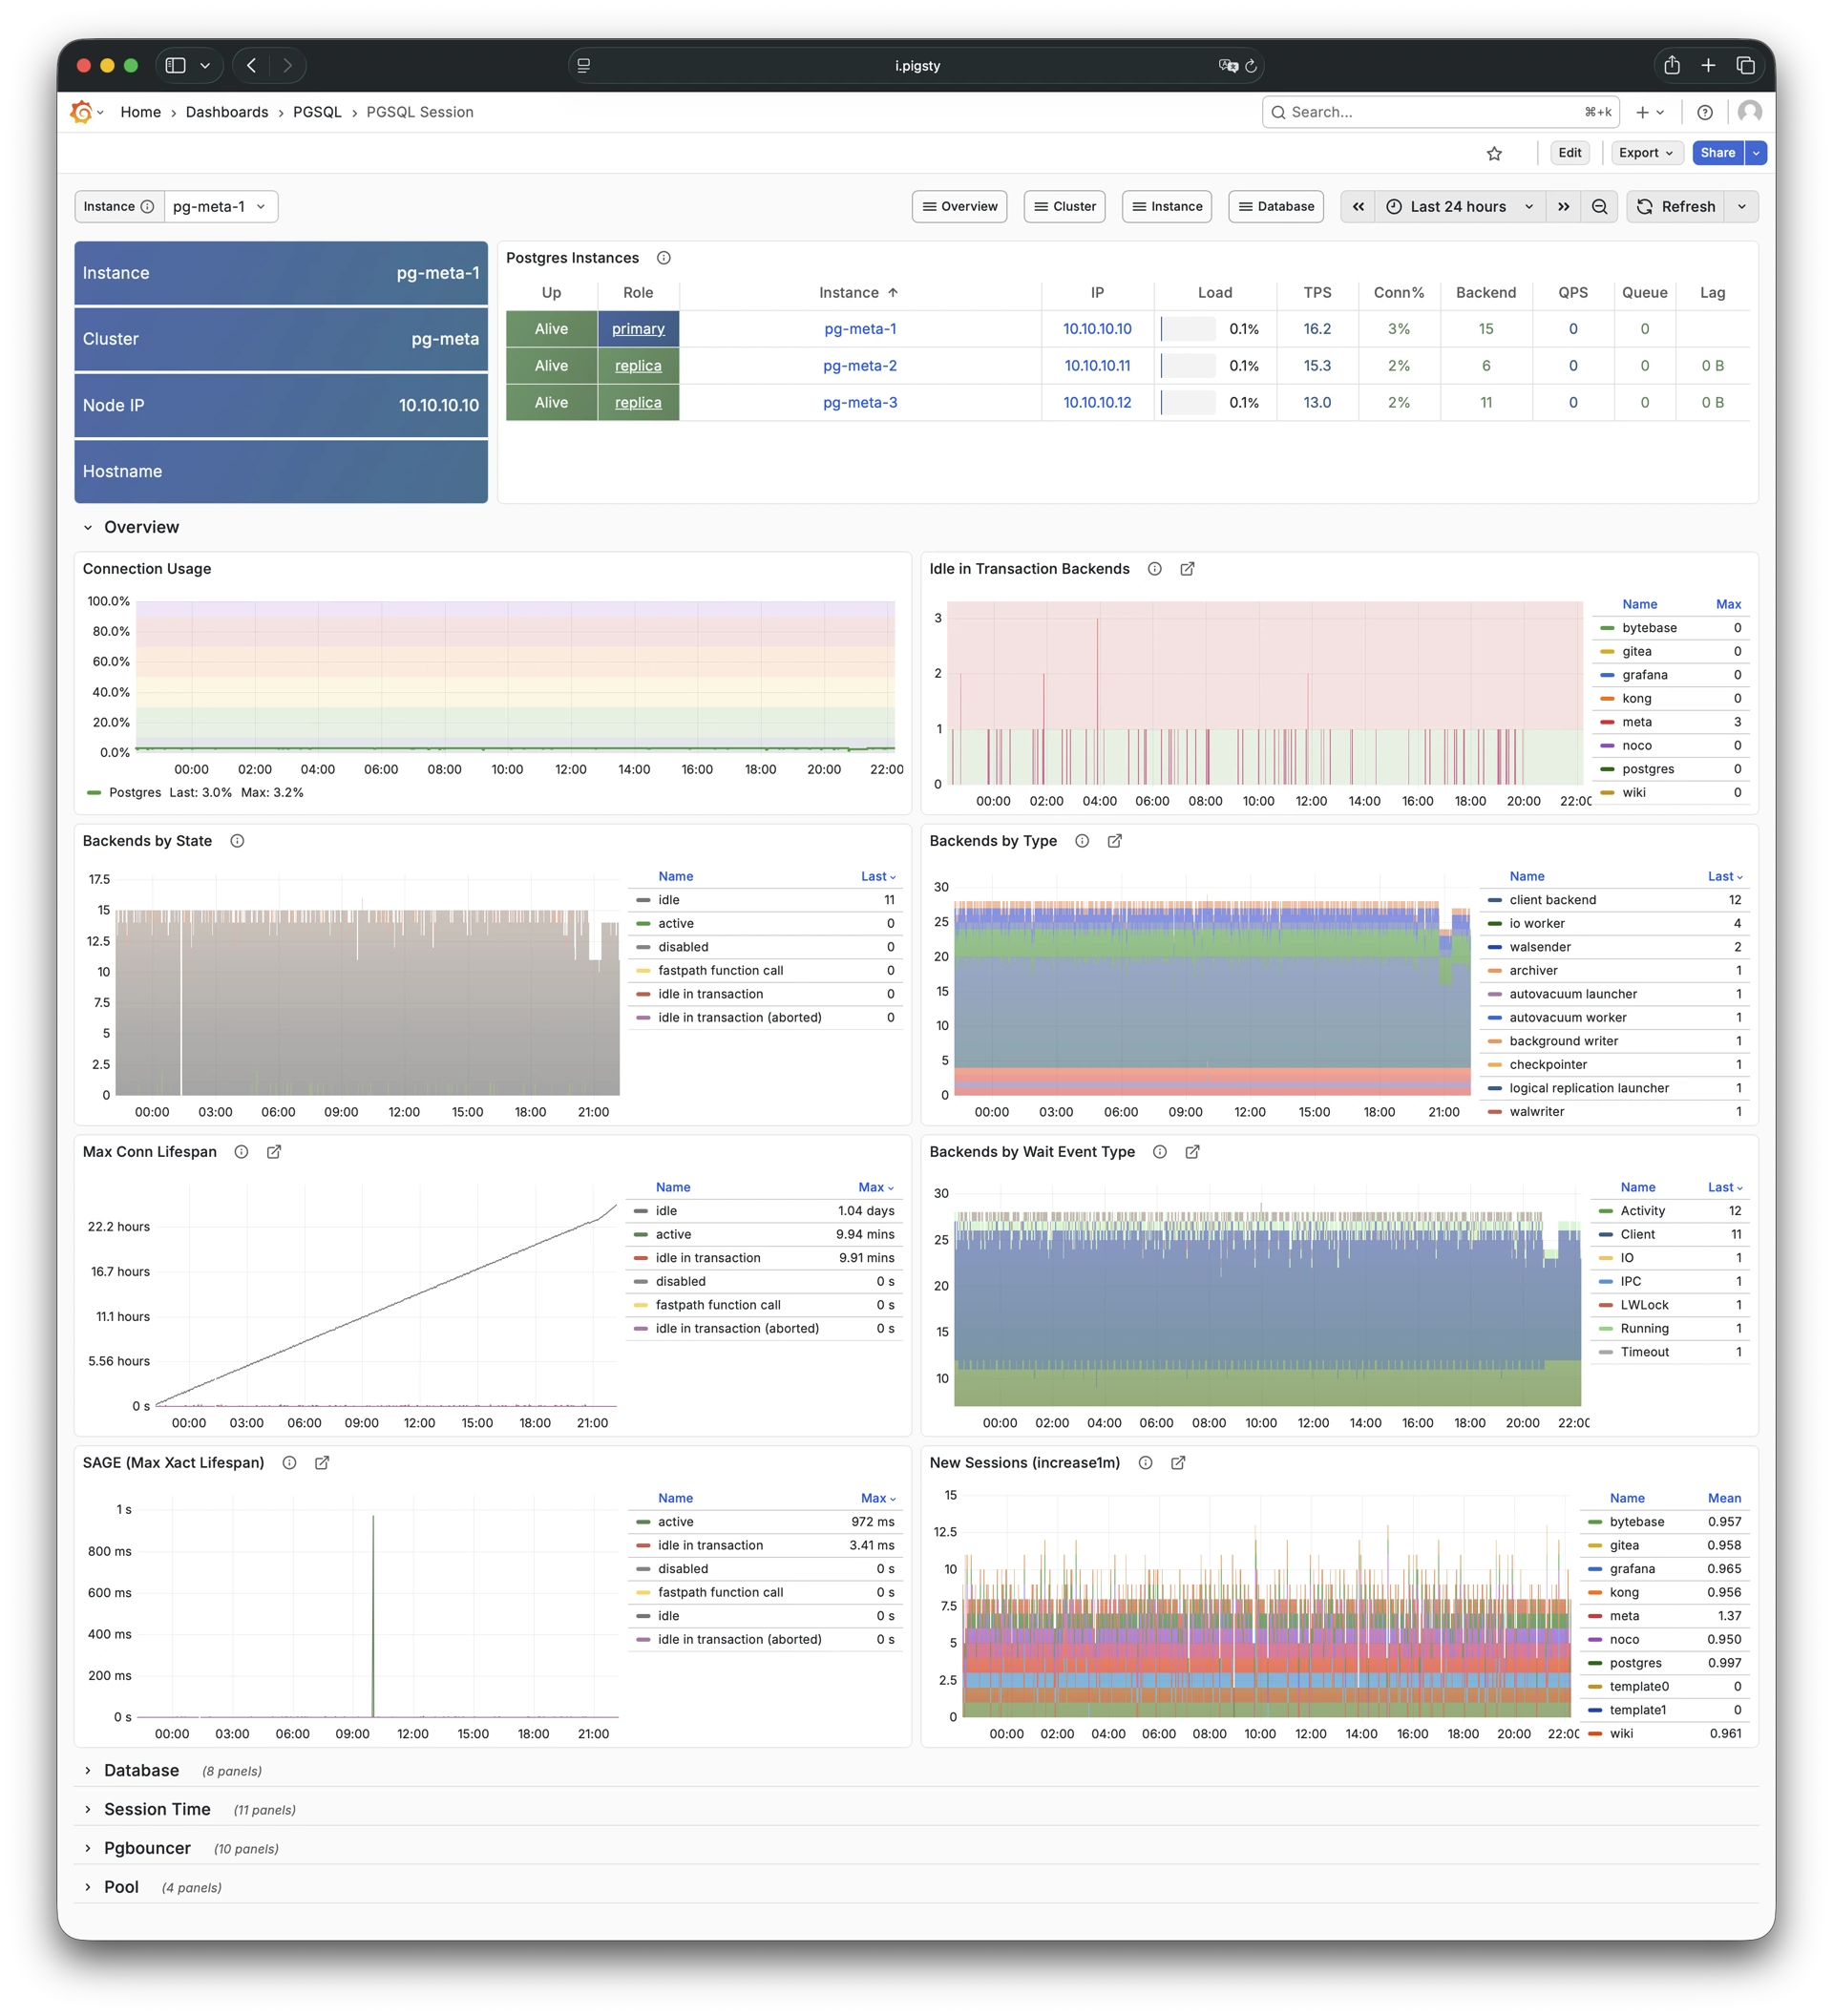
- pgsql-session: Session and active/idle time metrics for a single instance
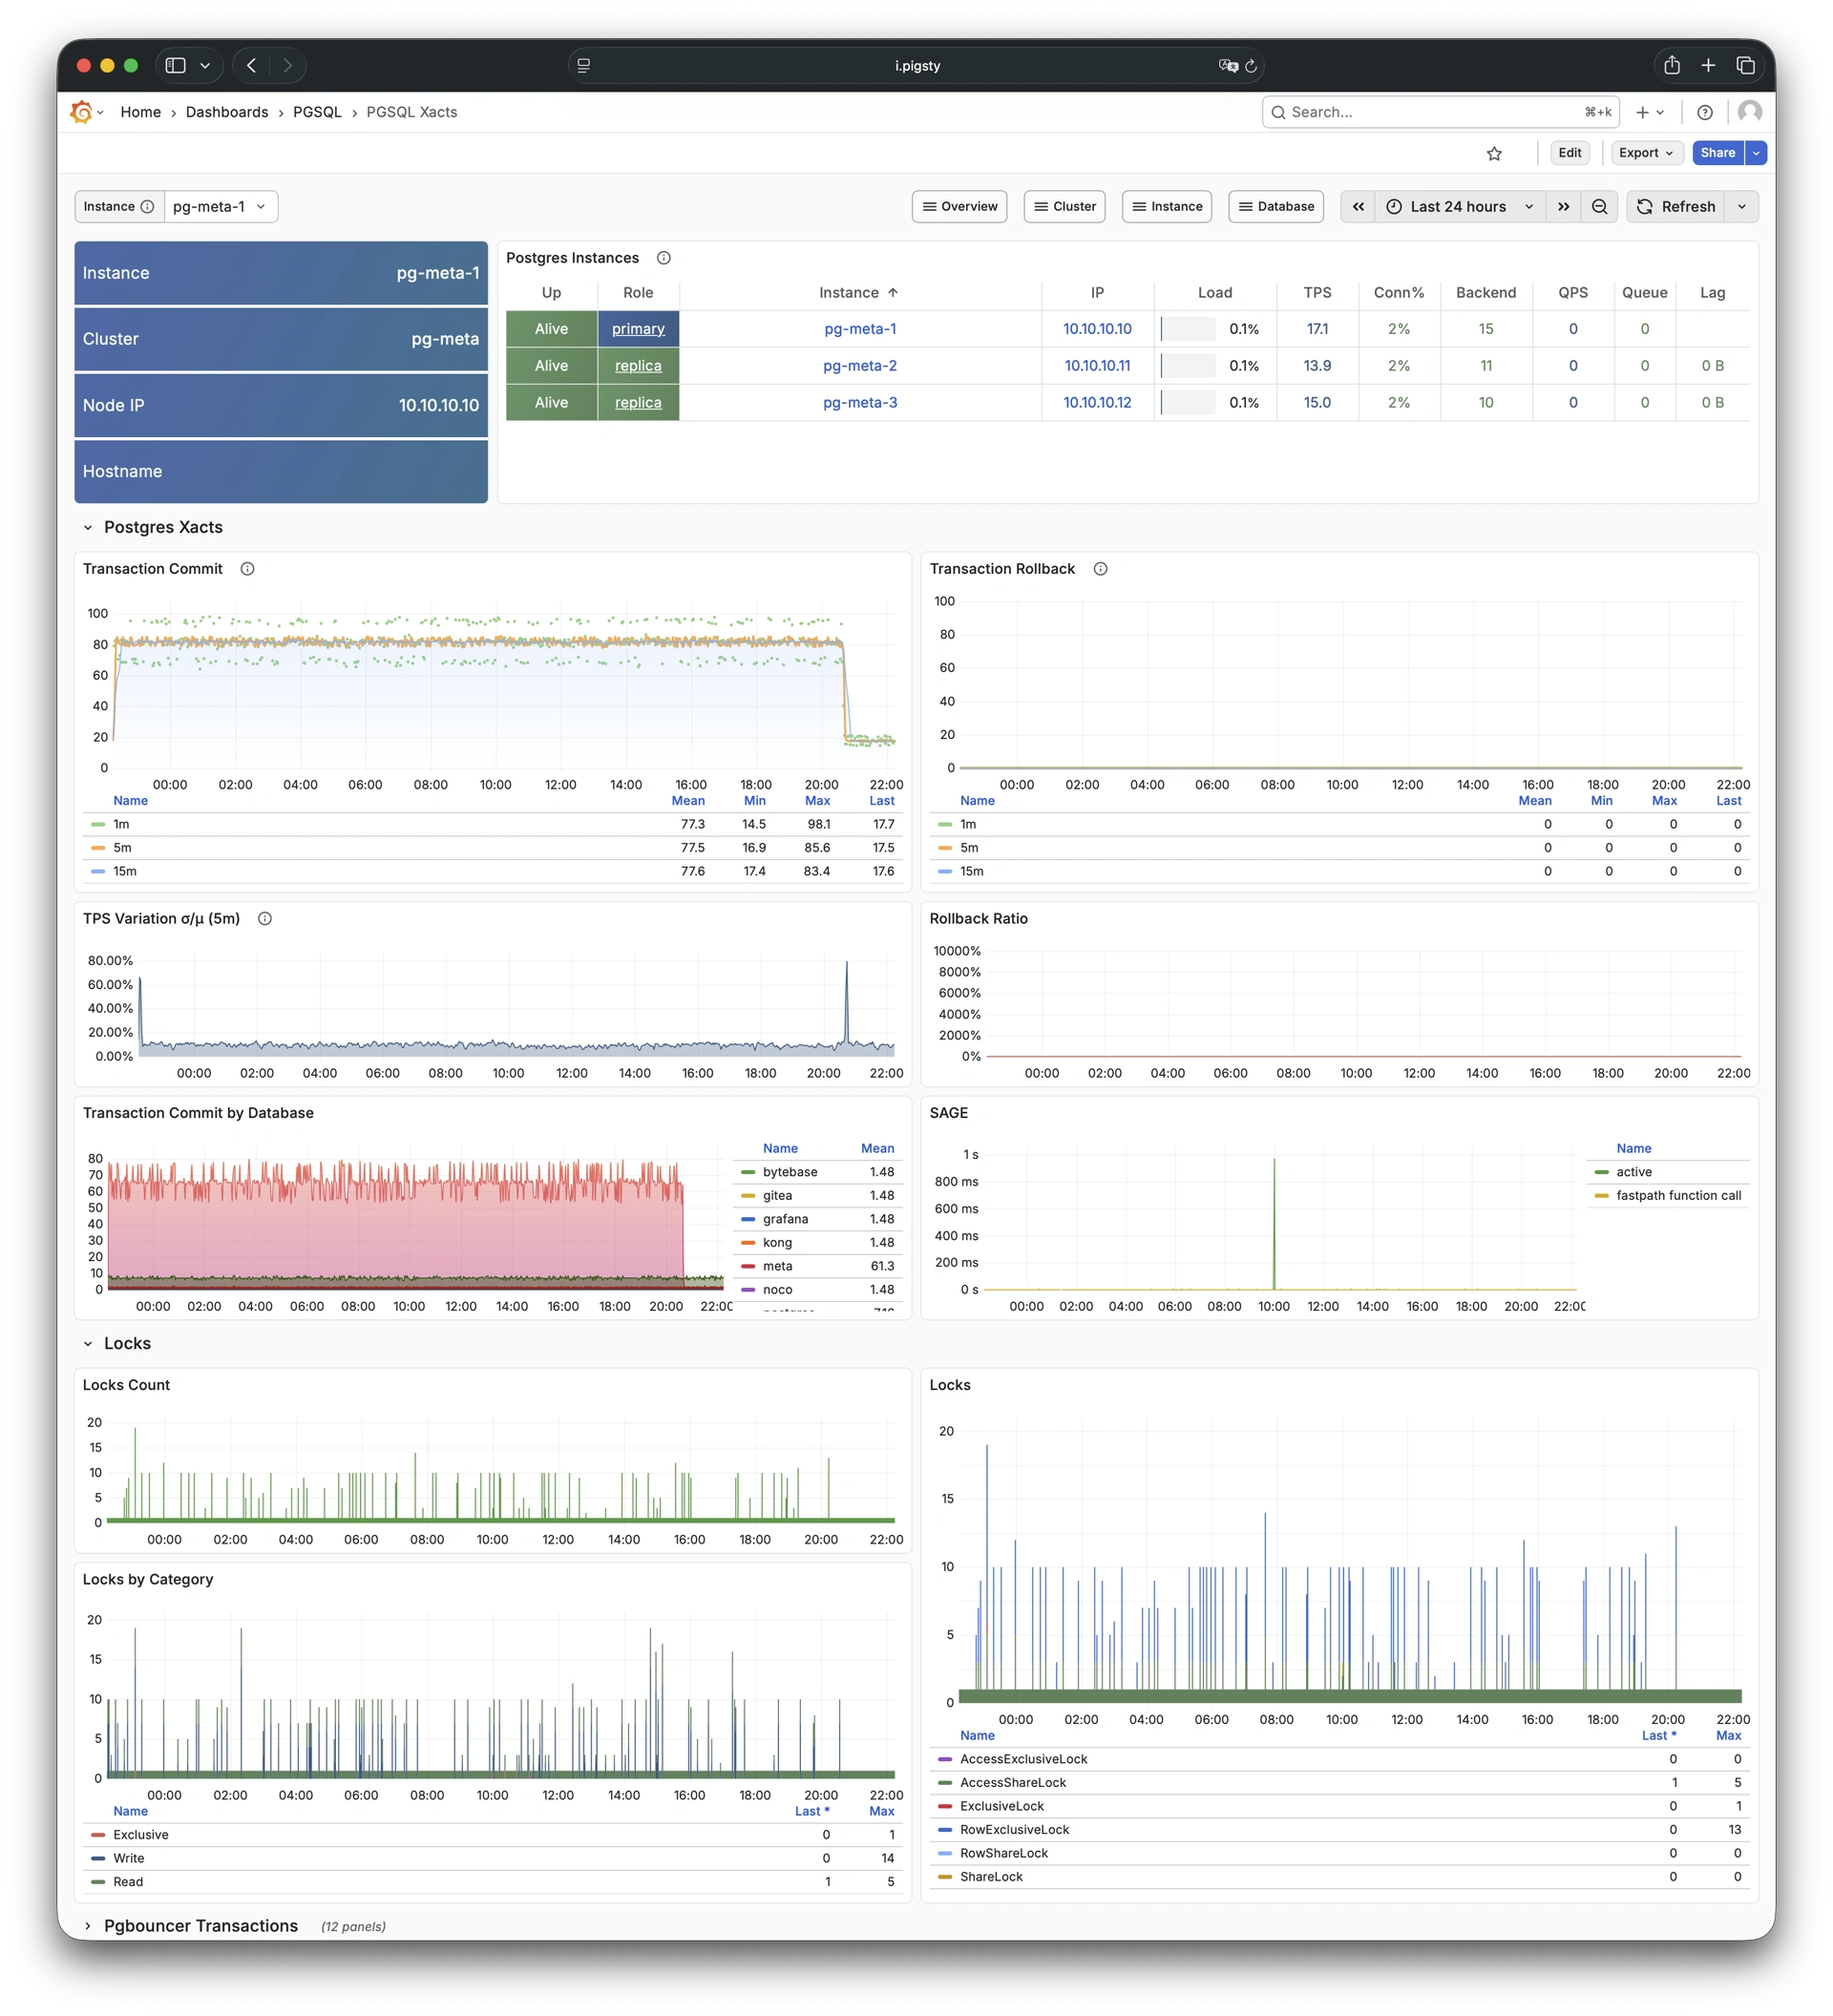
- pgsql-xacts: Transaction, lock, TPS/QPS related metrics
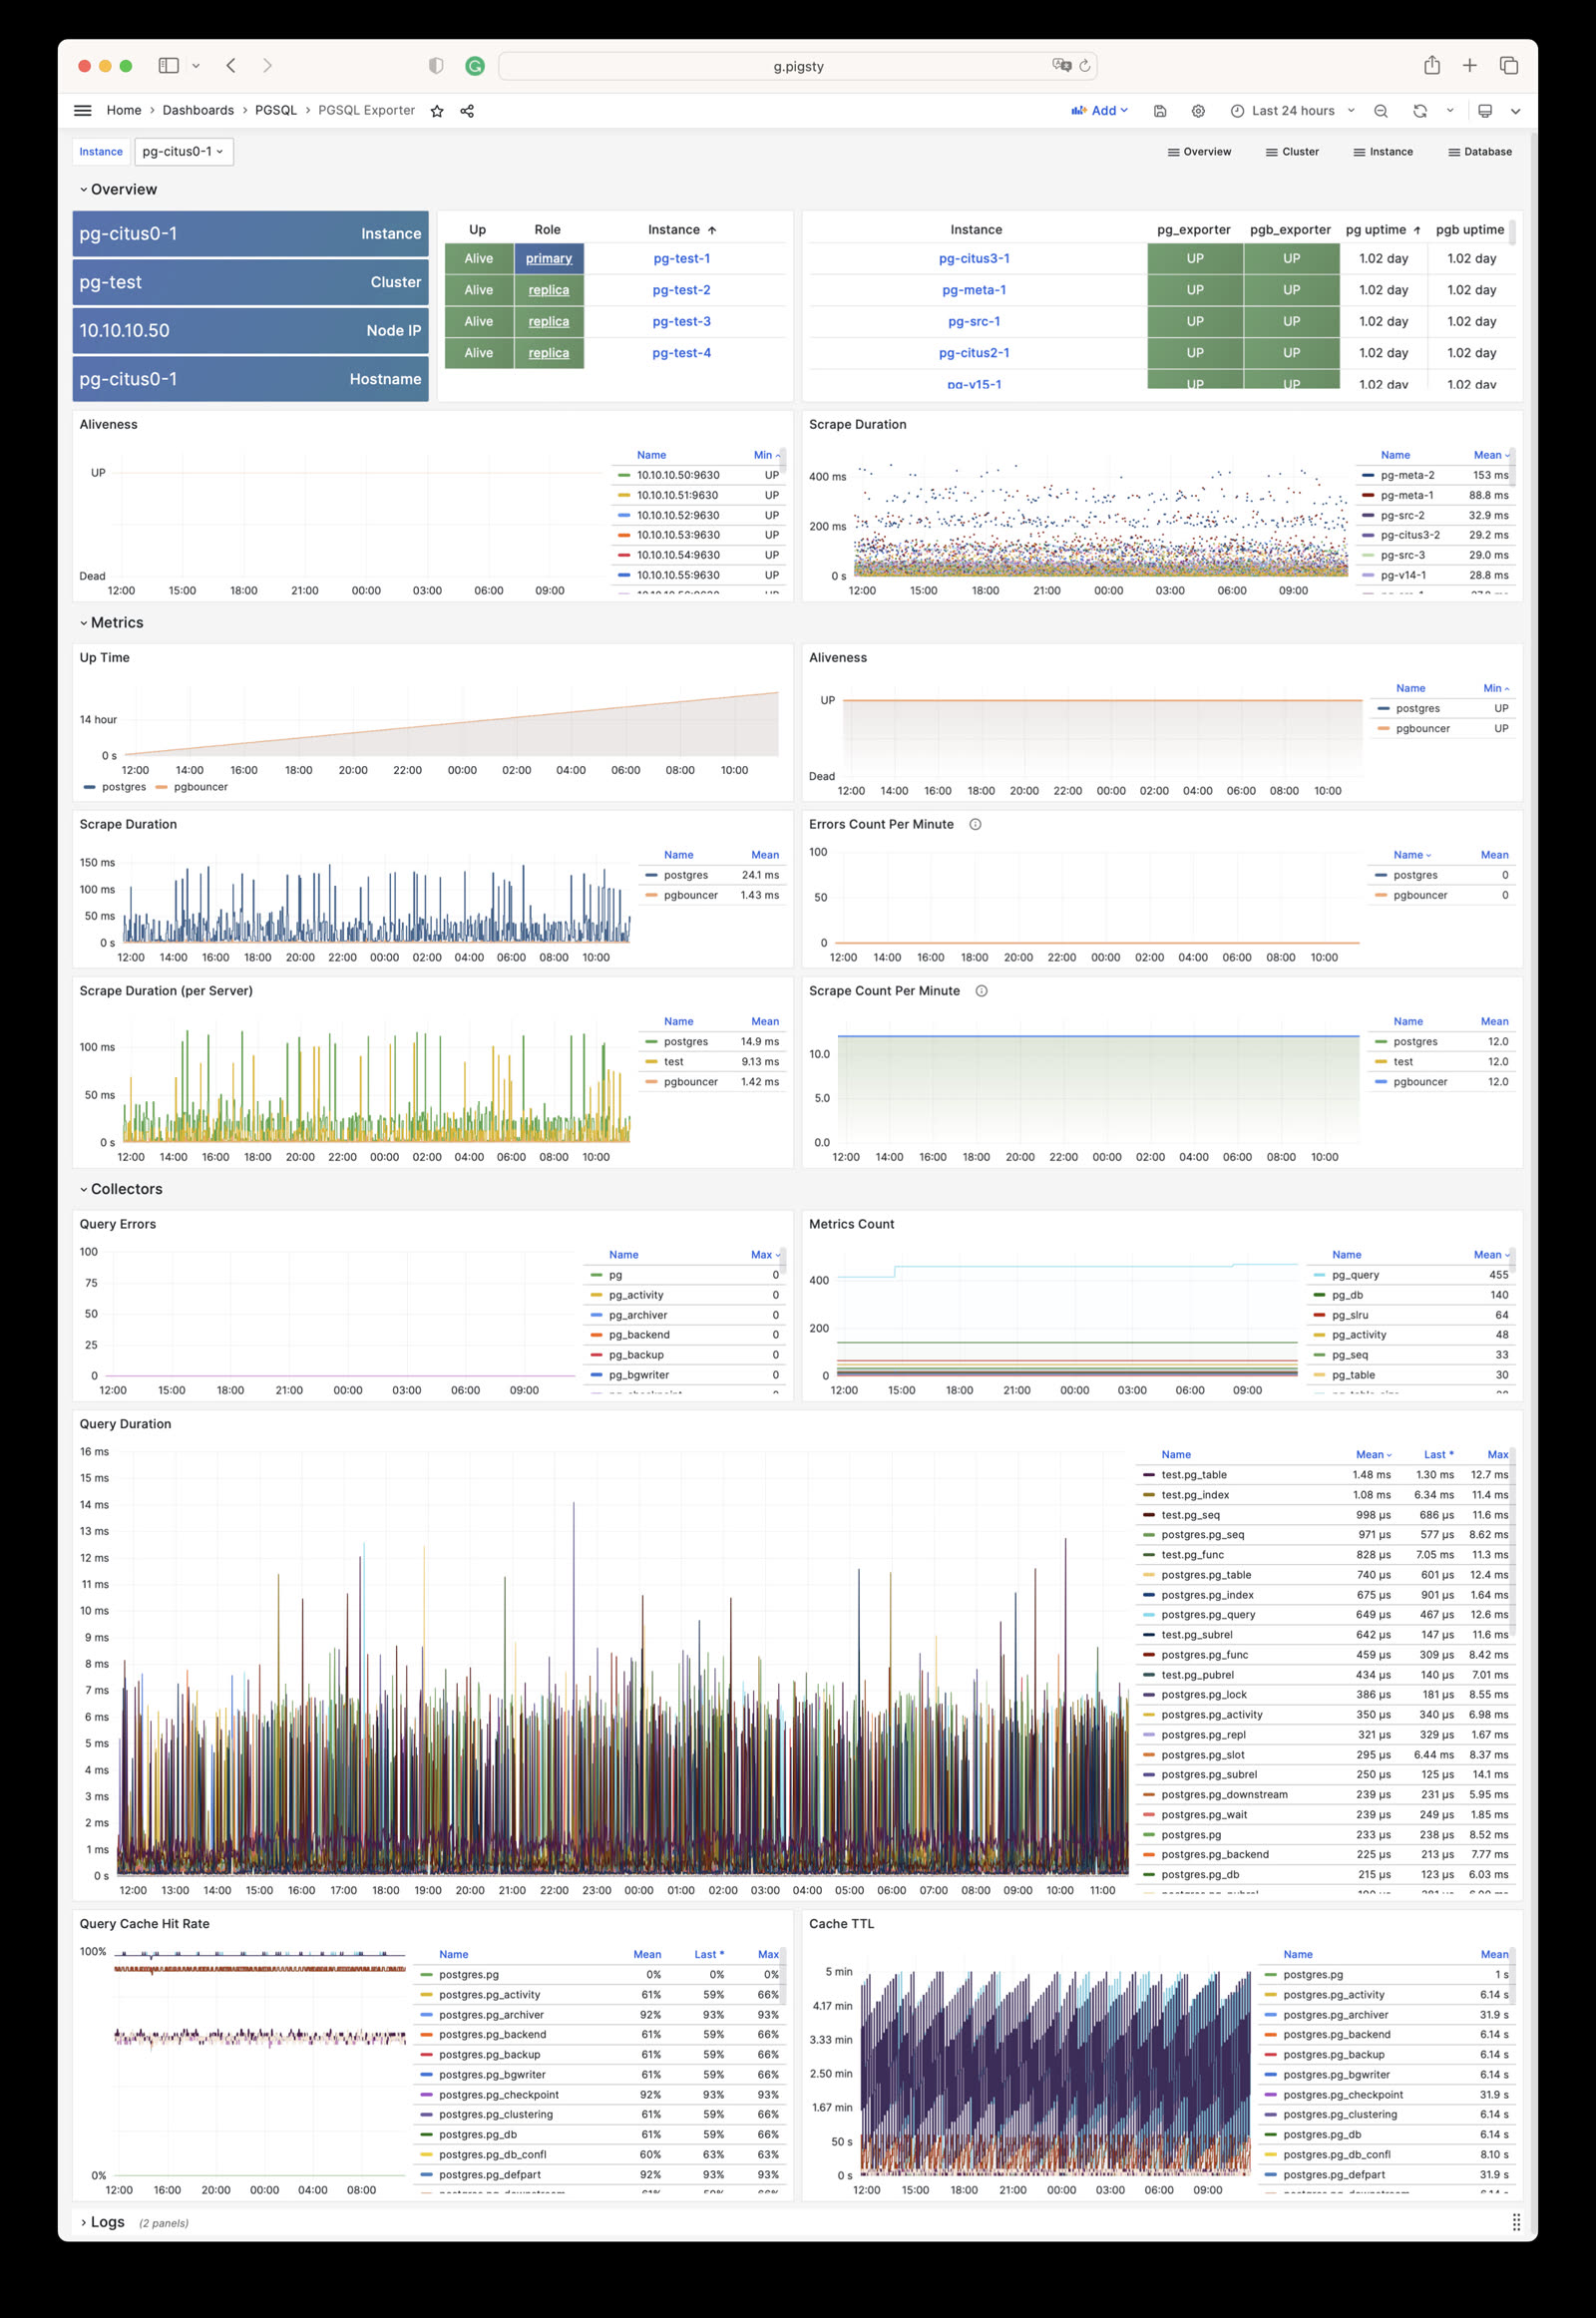
- pgsql-exporter: Self-monitoring metrics for Postgres and Pgbouncer exporters
Database
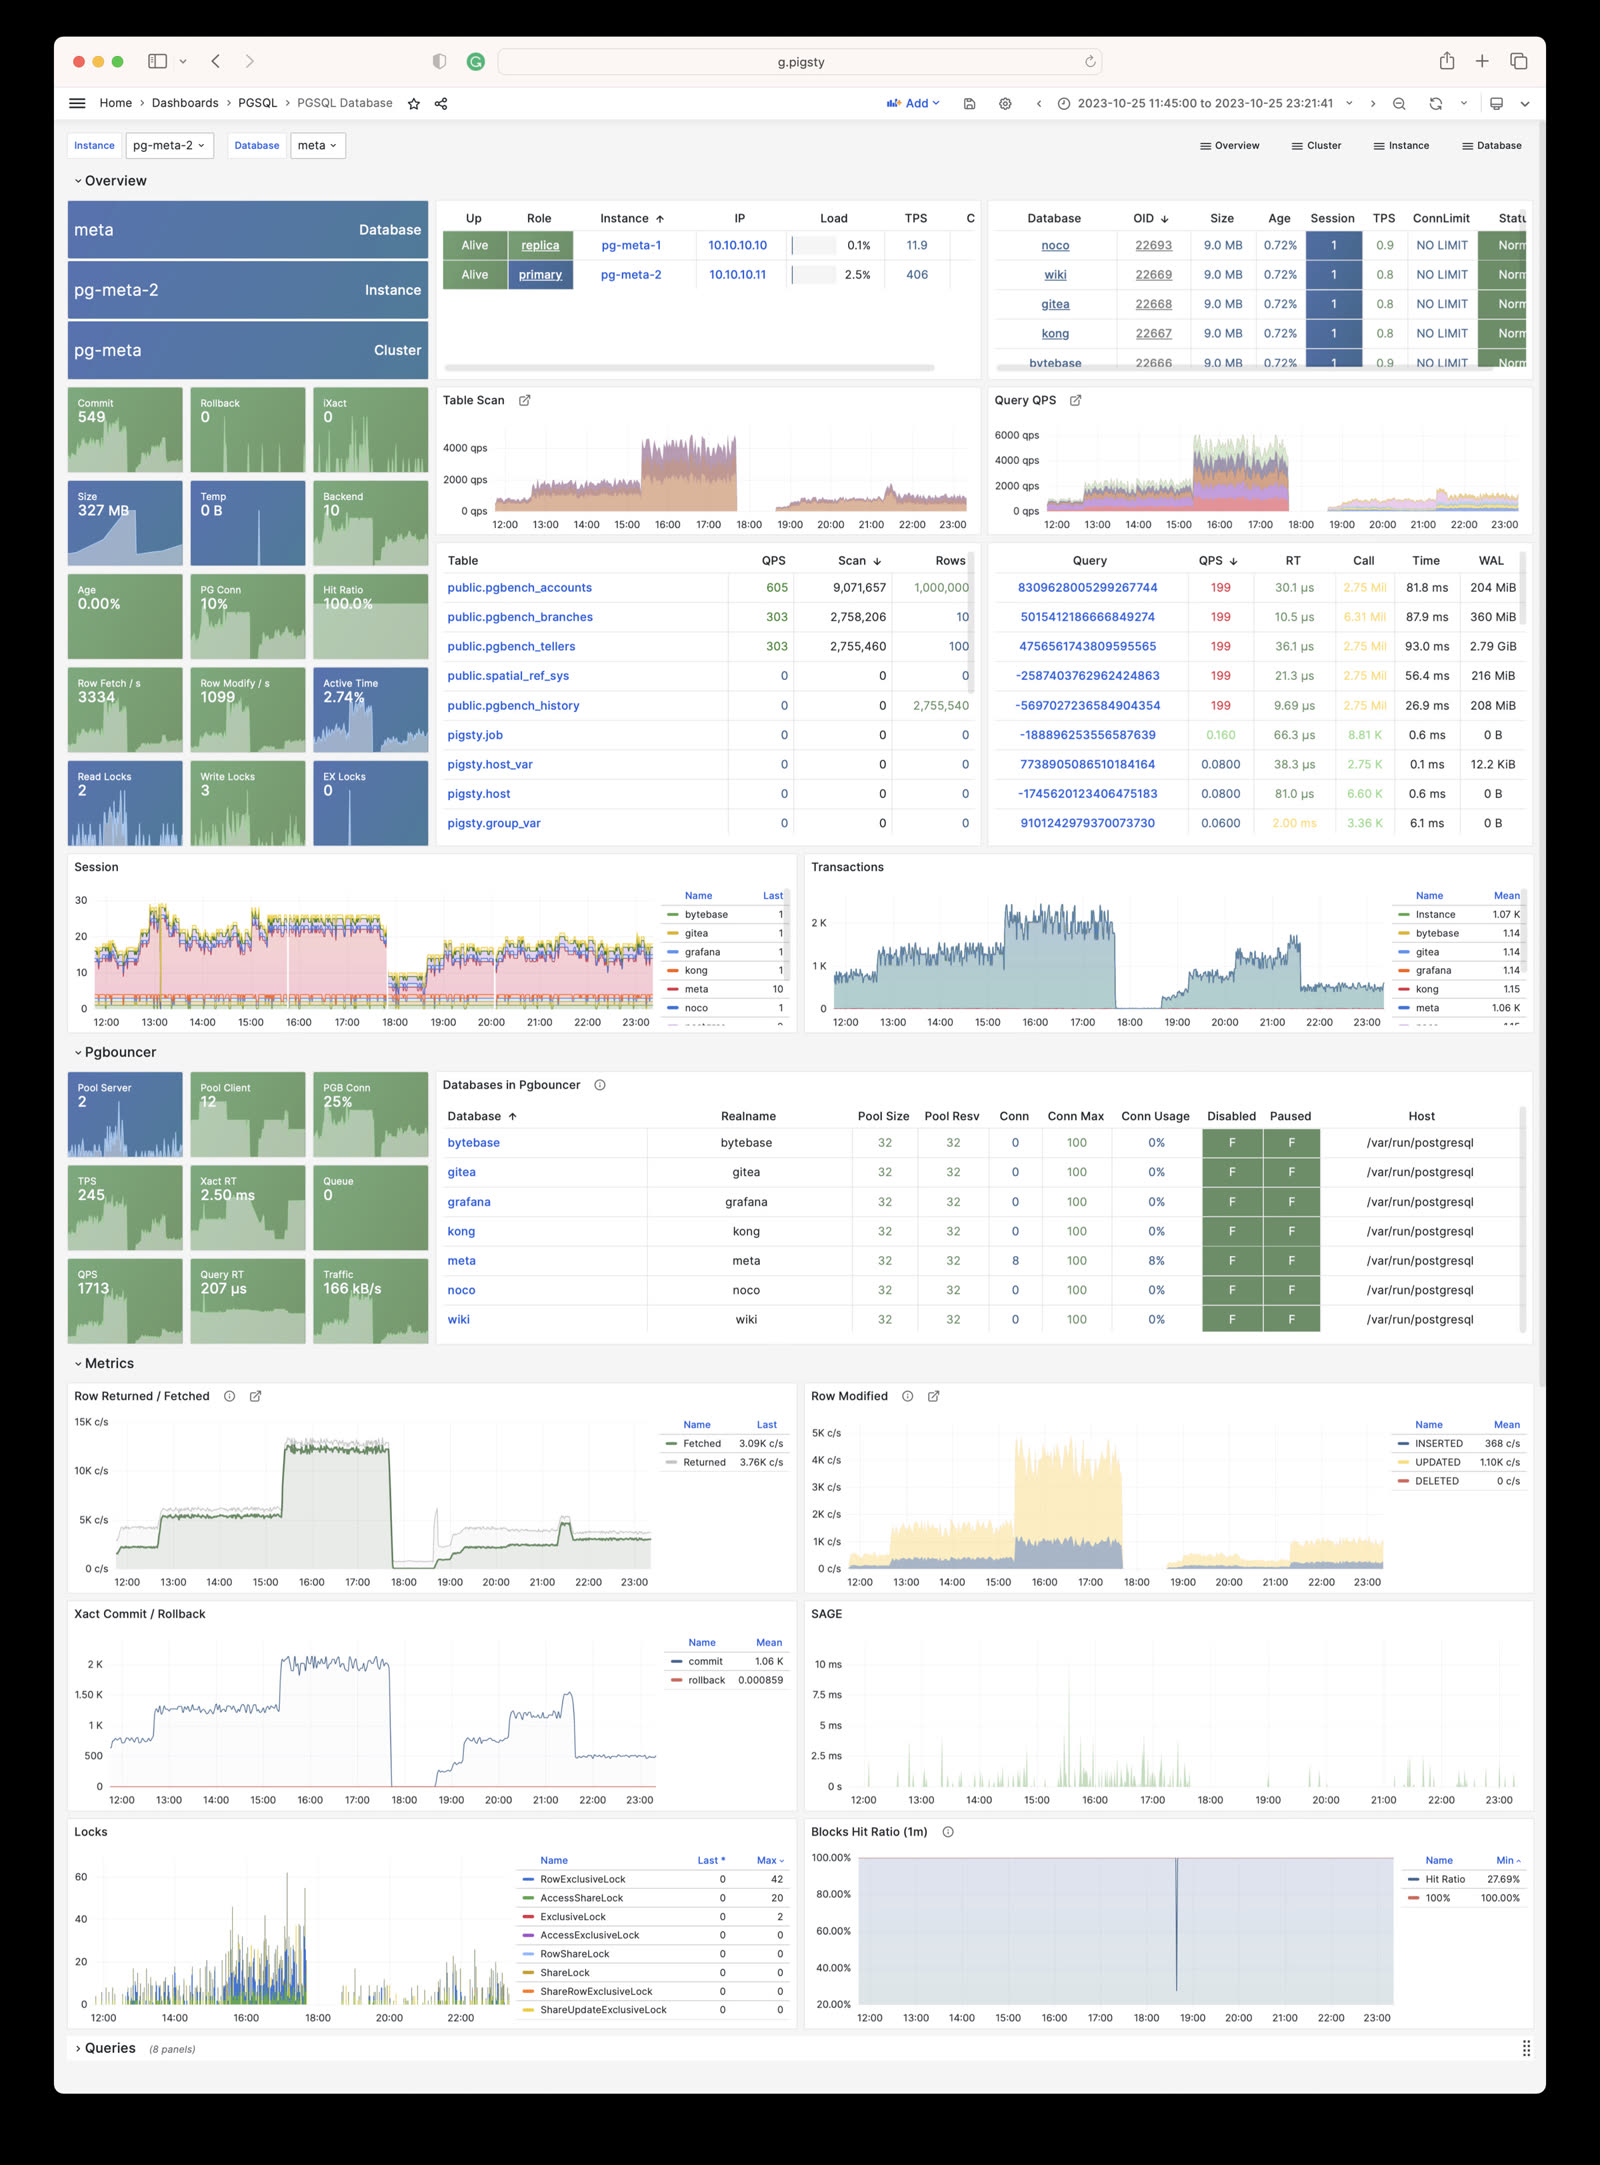
- pgsql-database: Main dashboard for a single PGSQL database
- pgcat-database: Database info retrieved directly from database catalog
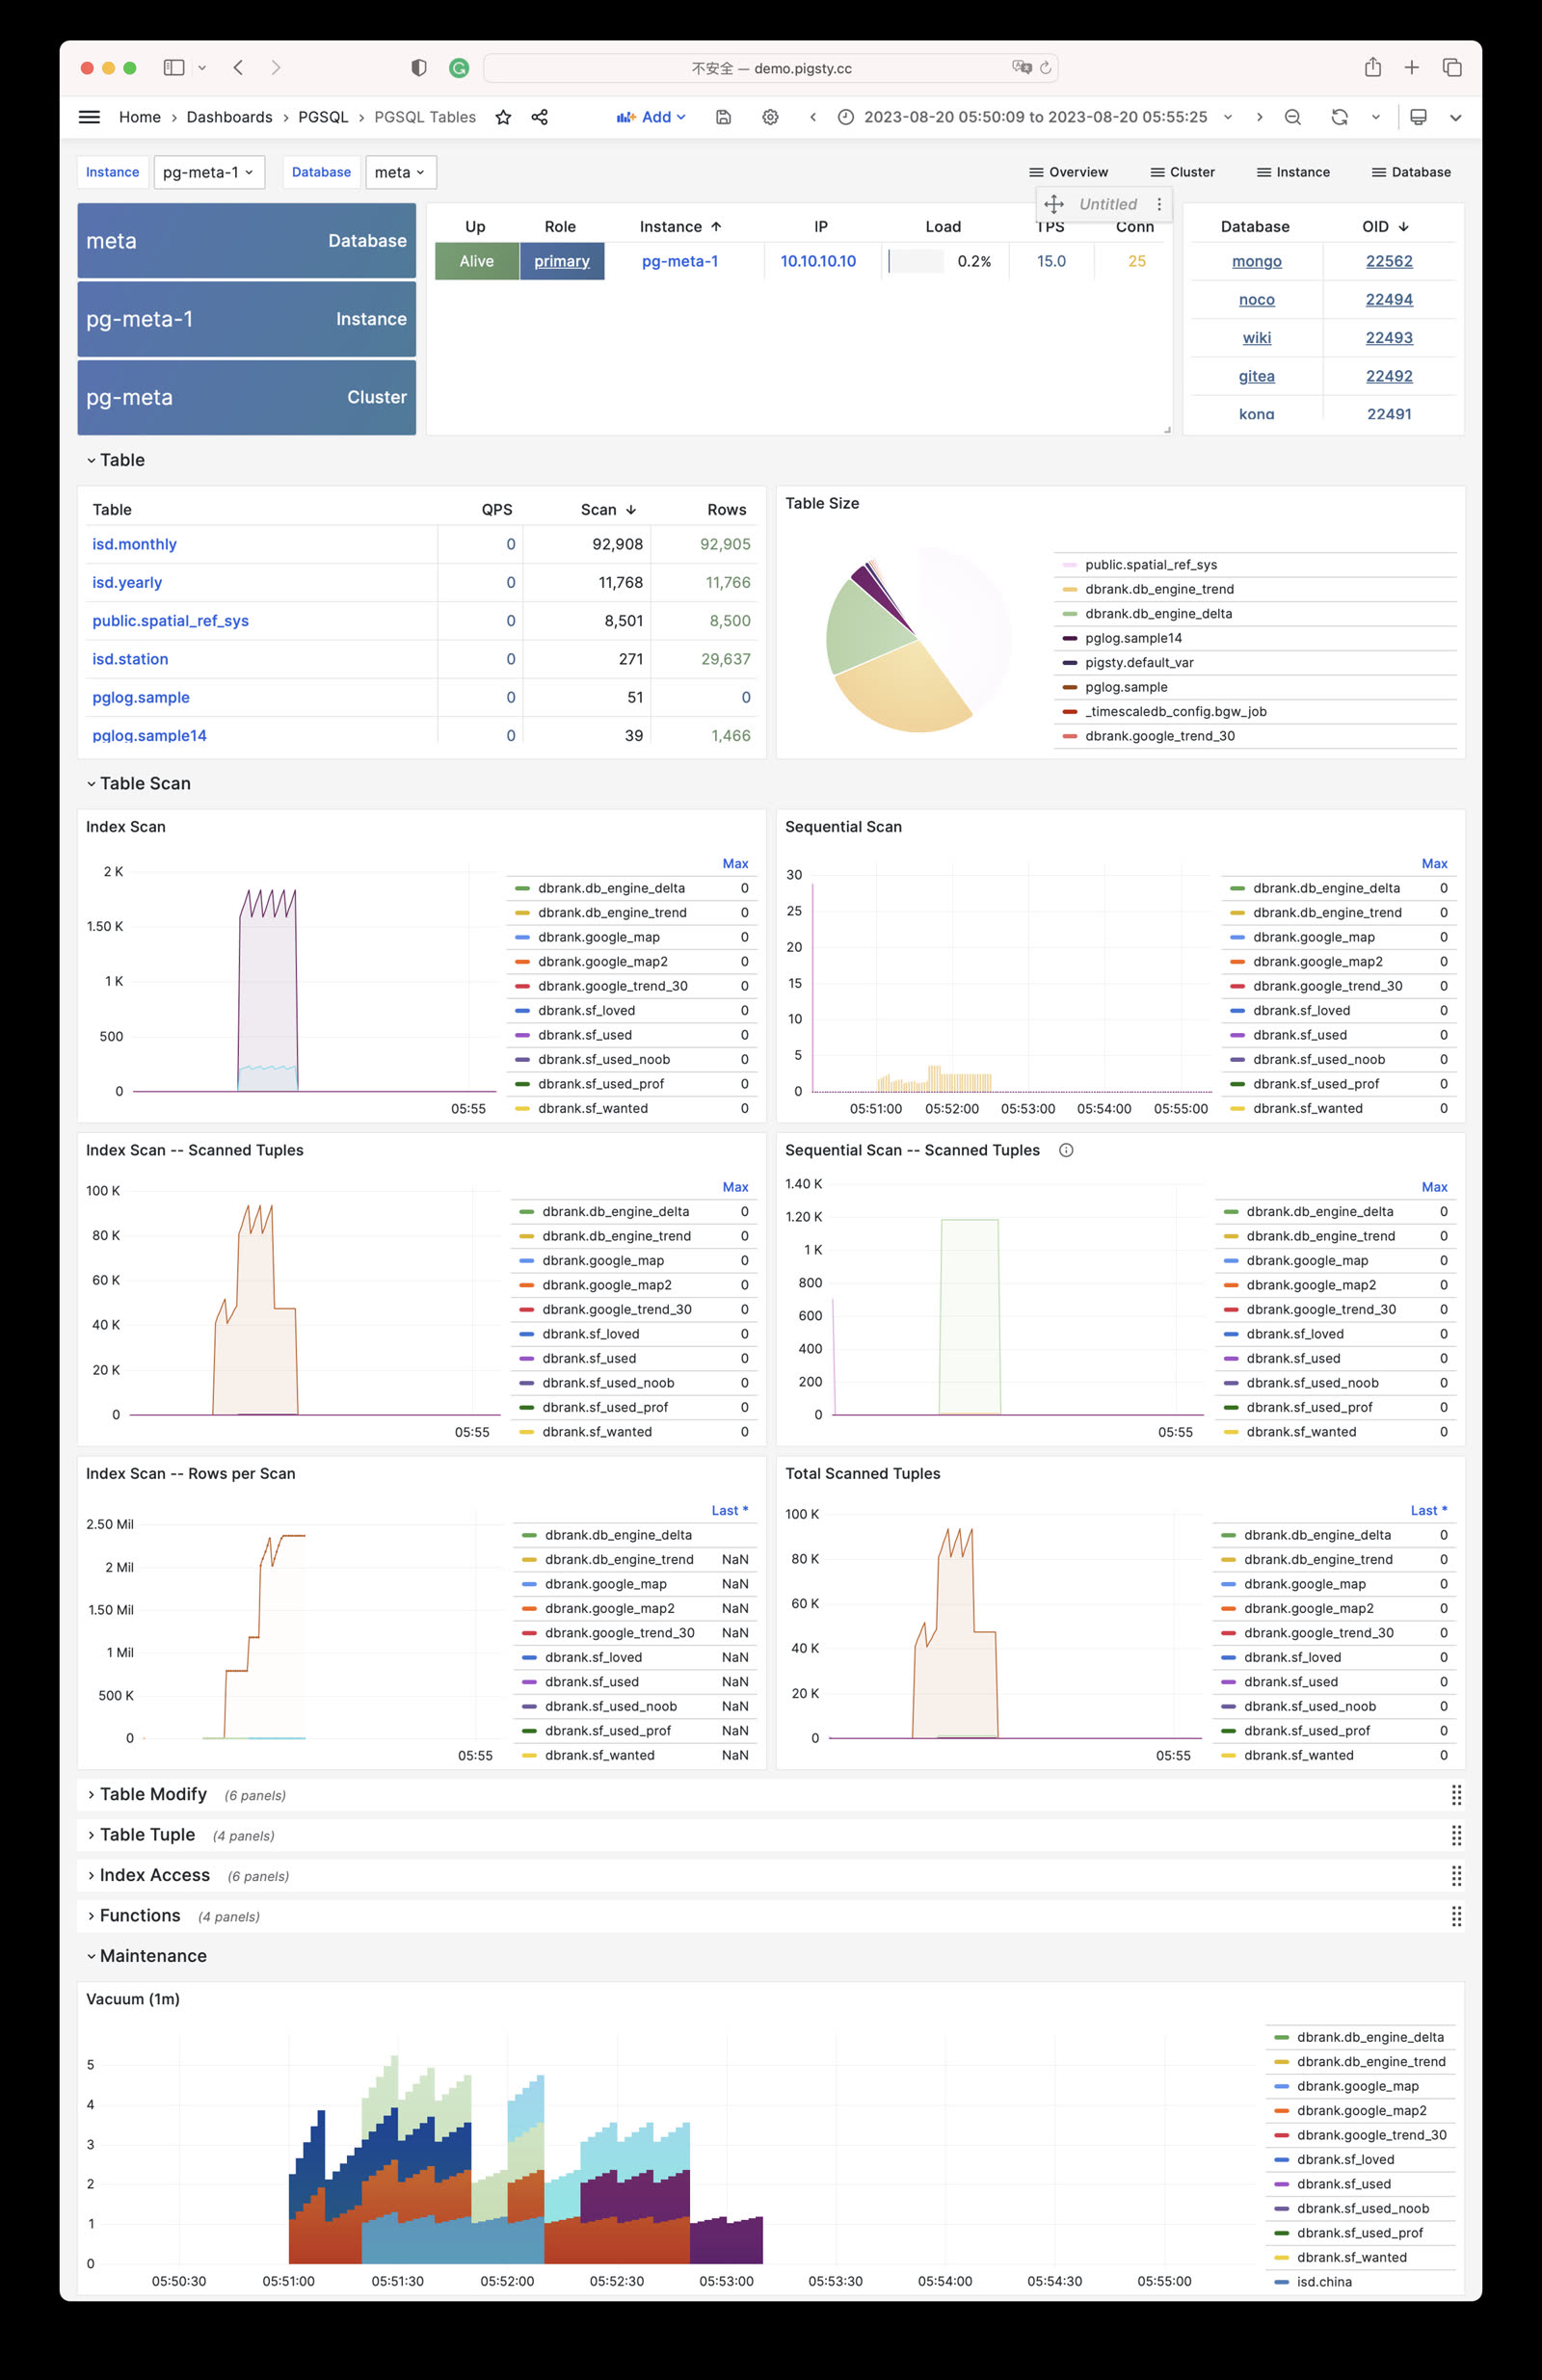
- pgsql-tables: Table/index access metrics within a single database
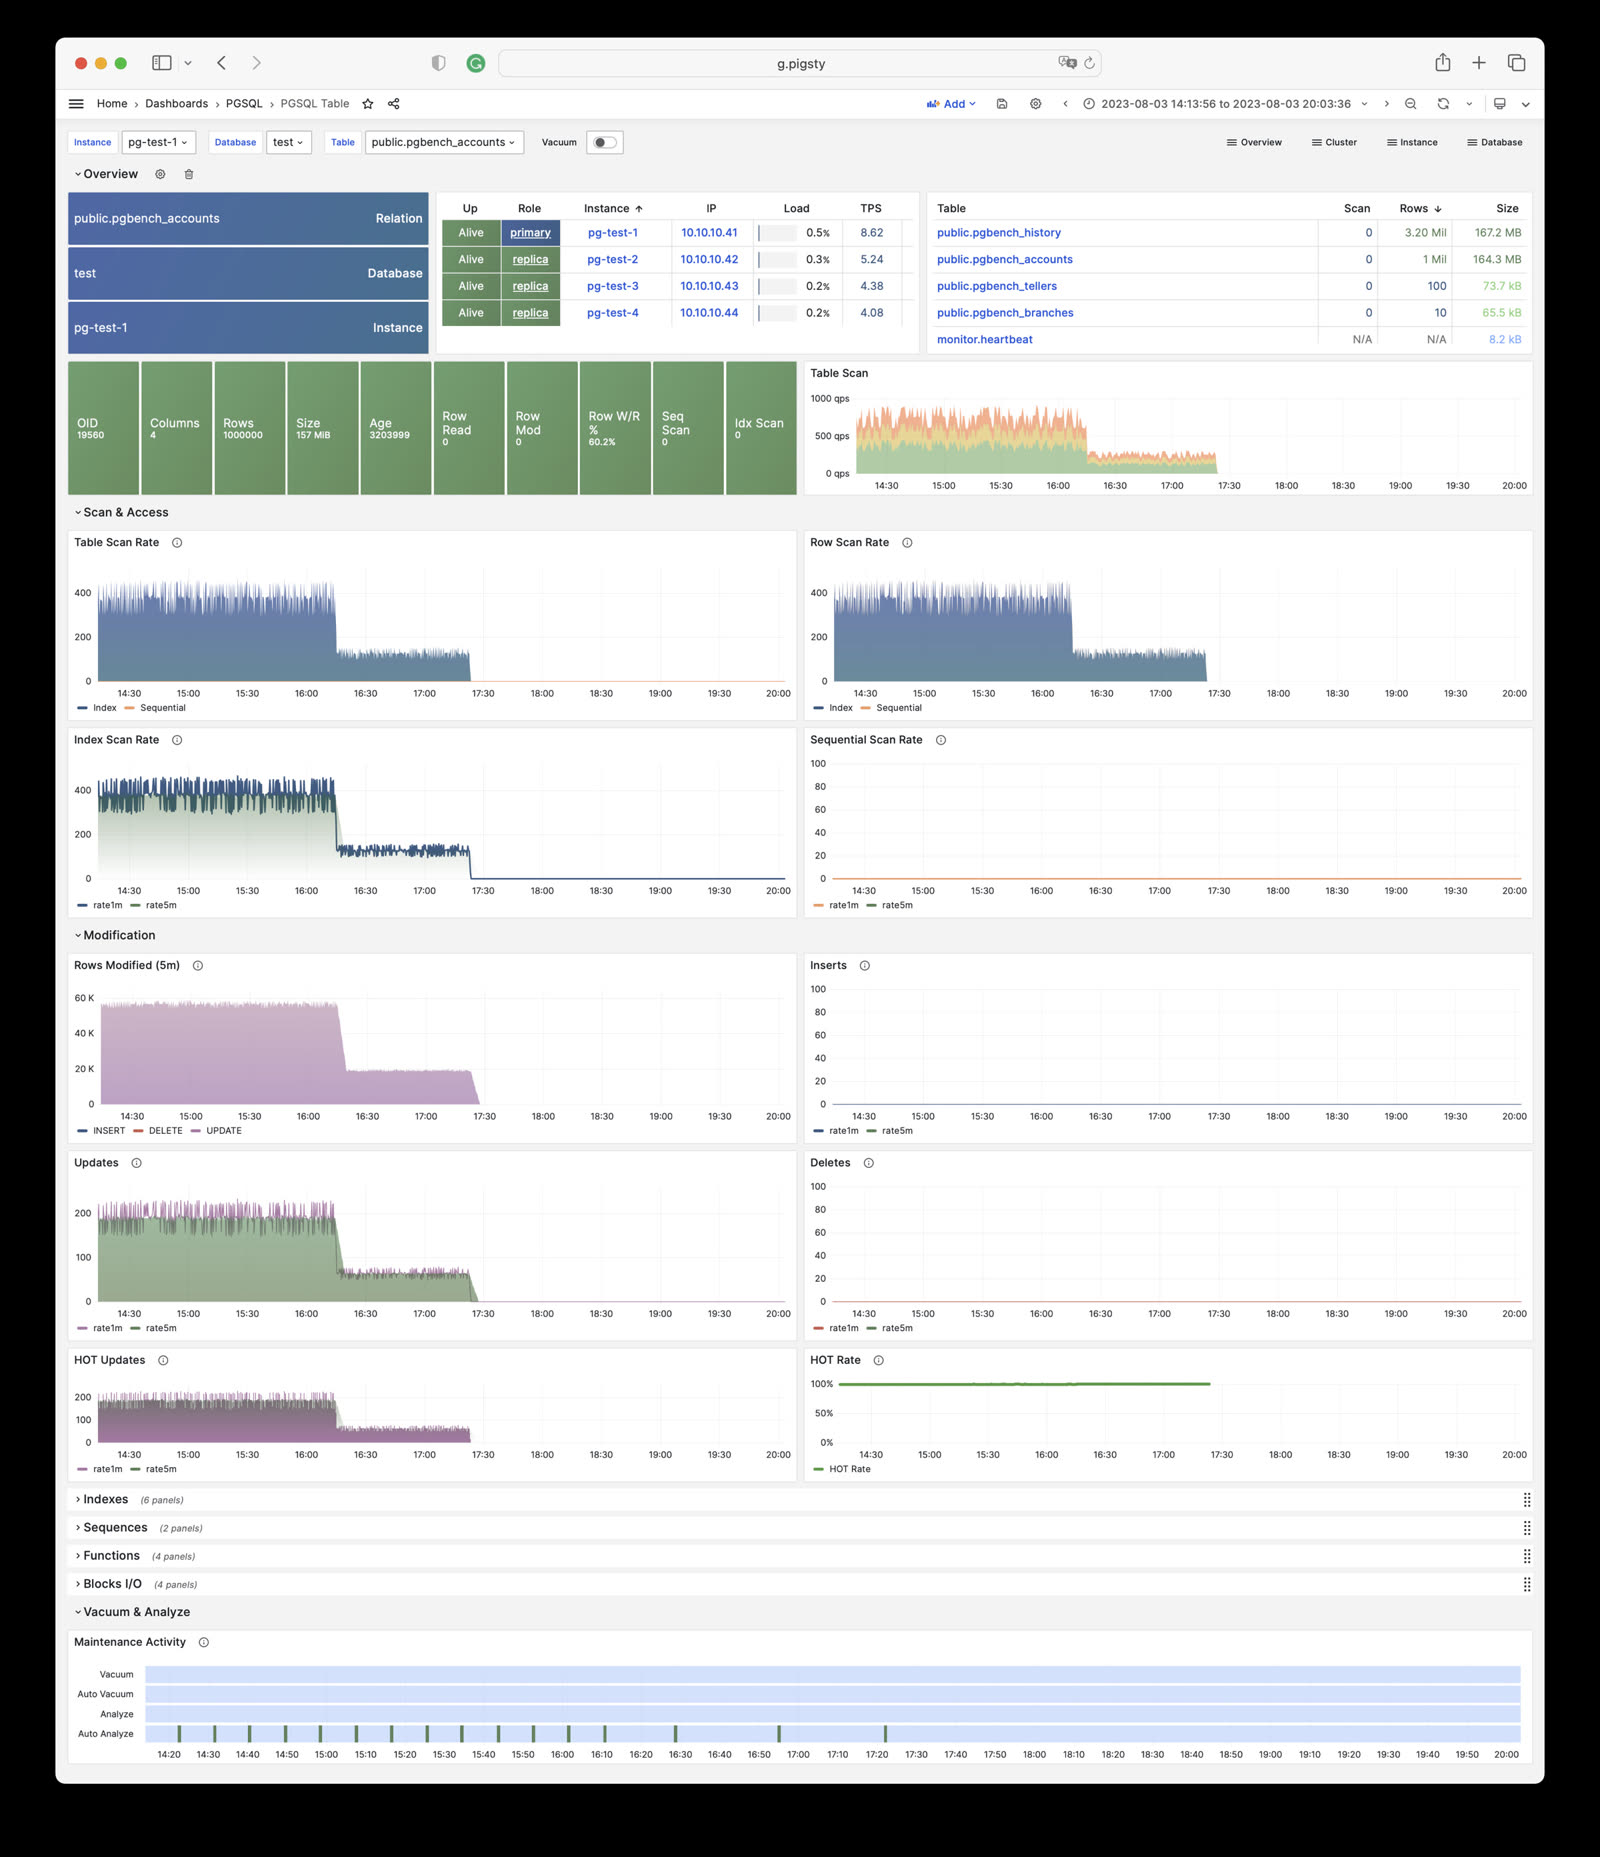
- pgsql-table: Detailed info for a single table (QPS/RT/index/sequence…)
- pgcat-table: Detailed table info from database catalog (stats/bloat…)
- pgsql-query: Detailed info for a query type (QPS/RT)
- pgcat-query: Query details from database catalog (SQL/stats)
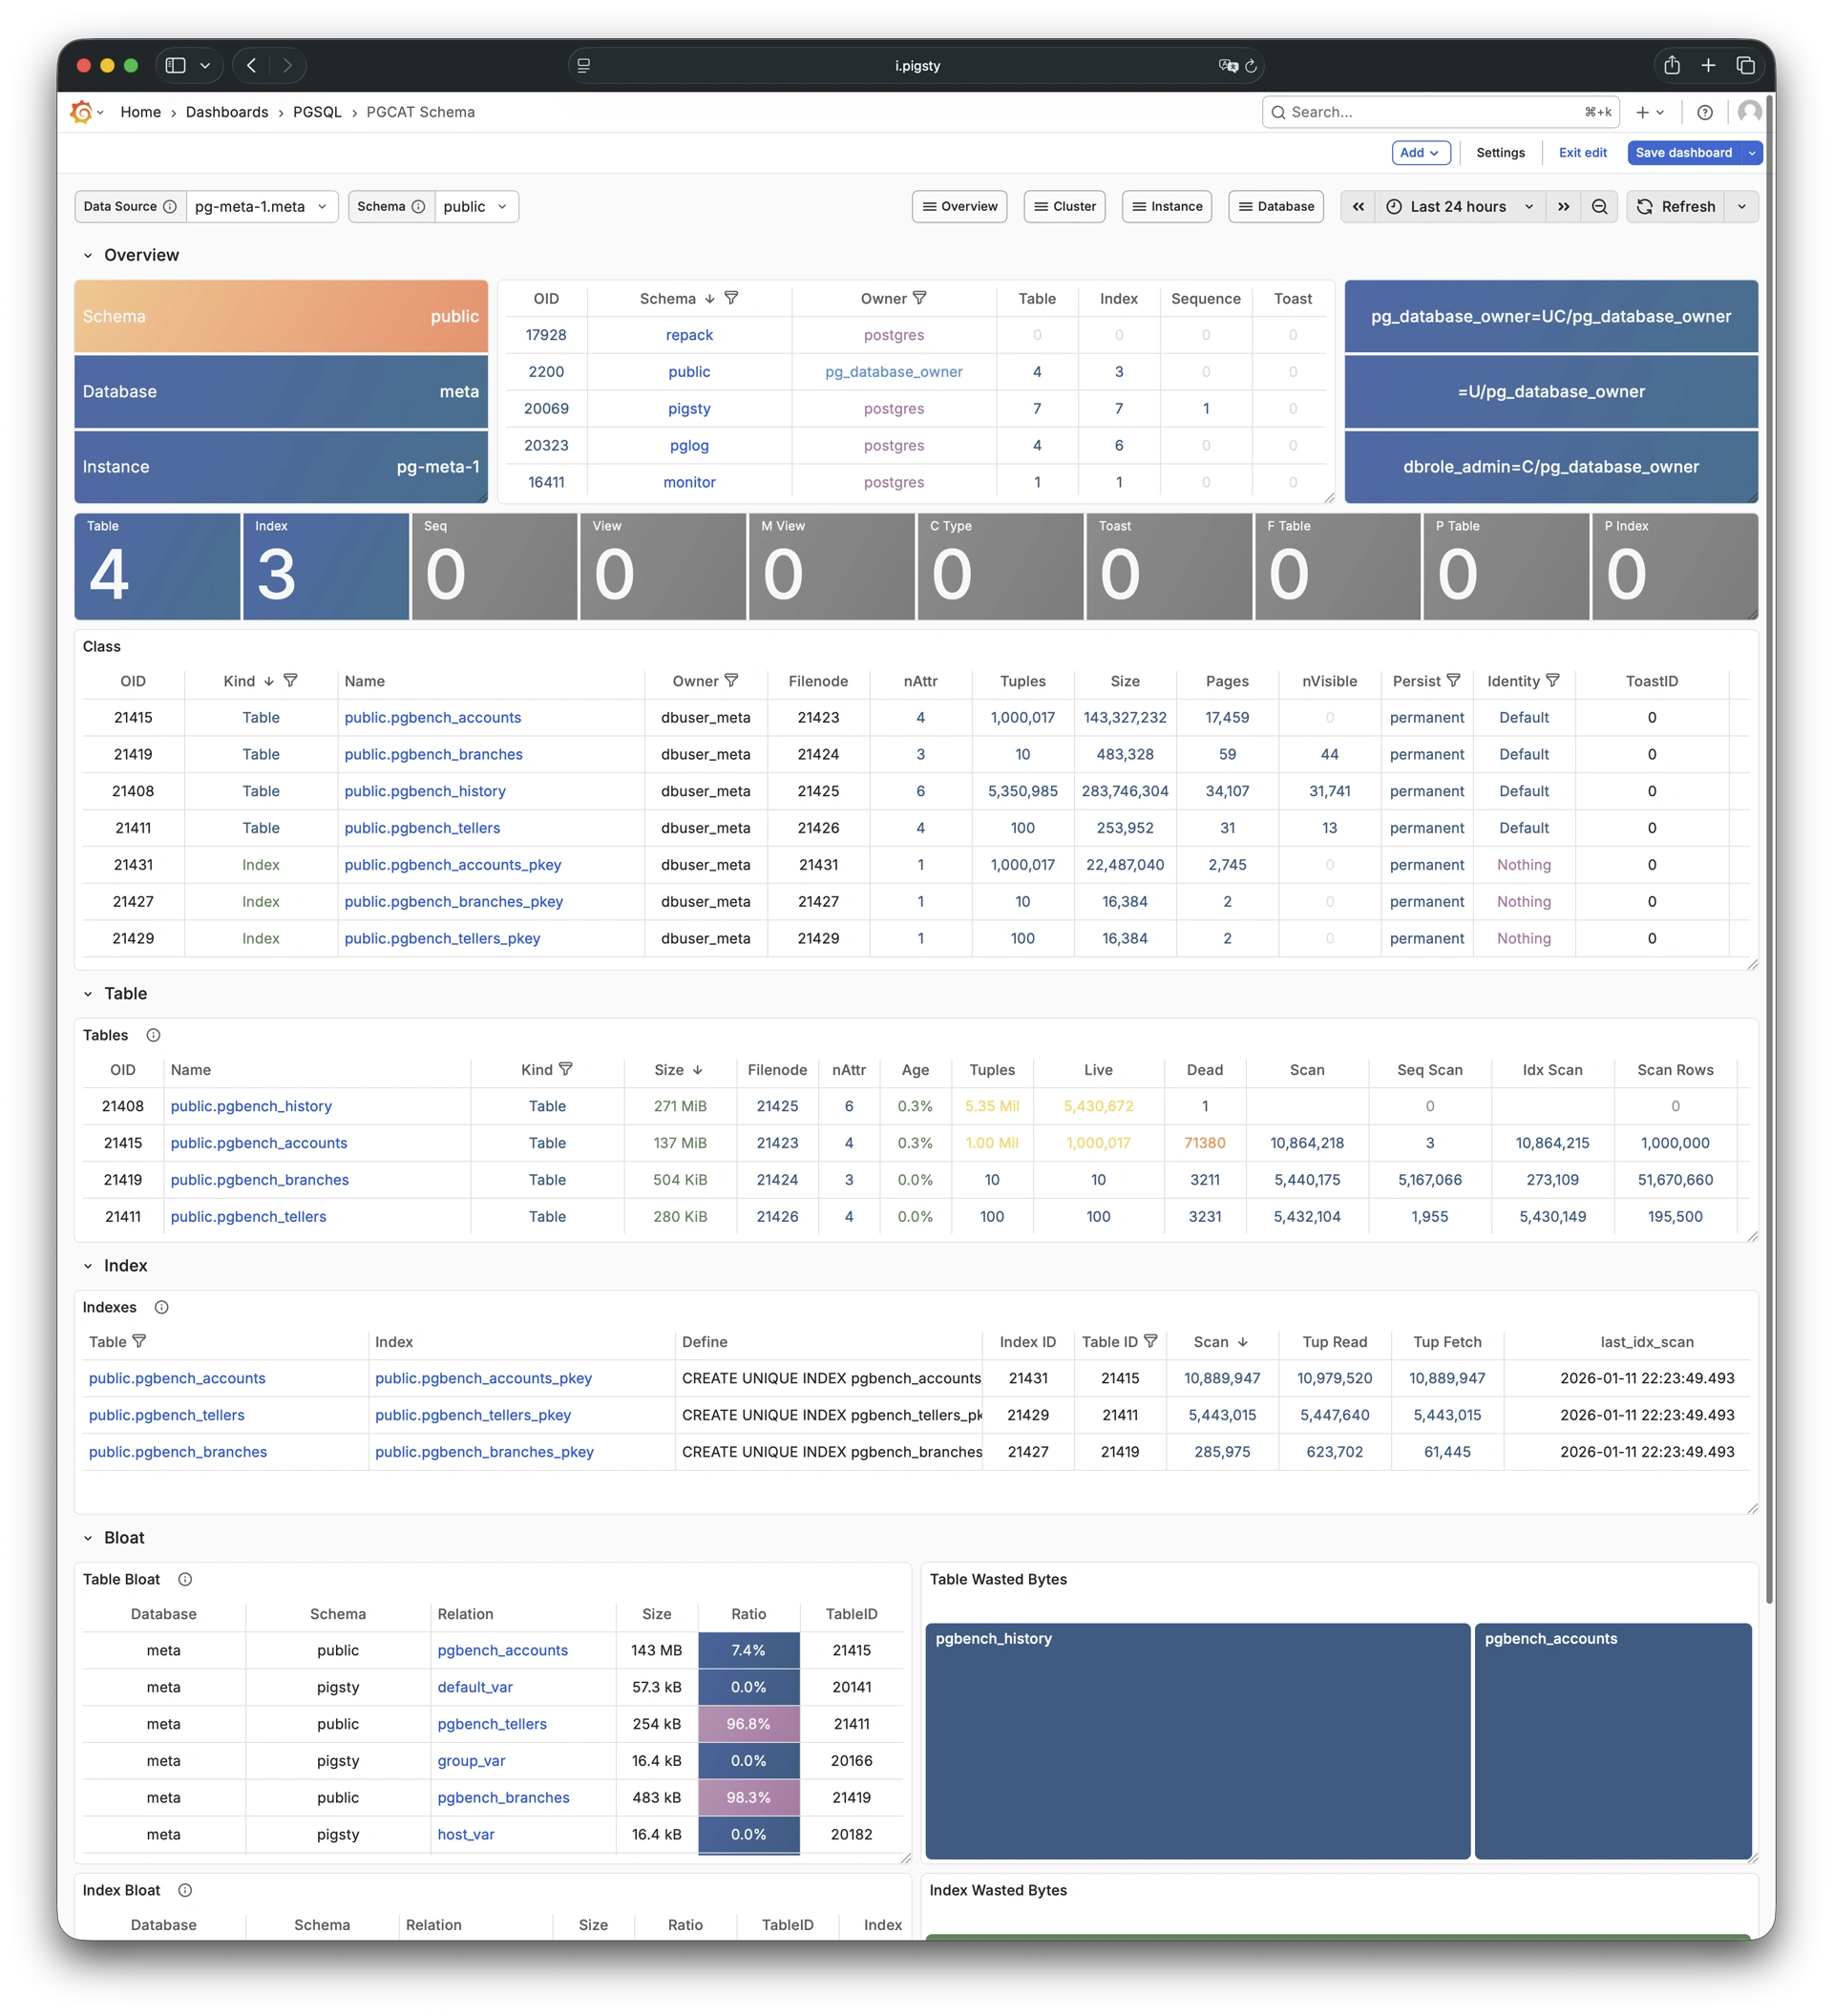
- pgcat-schema: Schema info from database catalog (tables/indexes/sequences…)
- pgcat-locks: Activity and lock wait info from database catalog
Overview
PGSQL Overview: Main dashboard for the PGSQL module
PGSQL Alert: Global core metrics overview and alert events
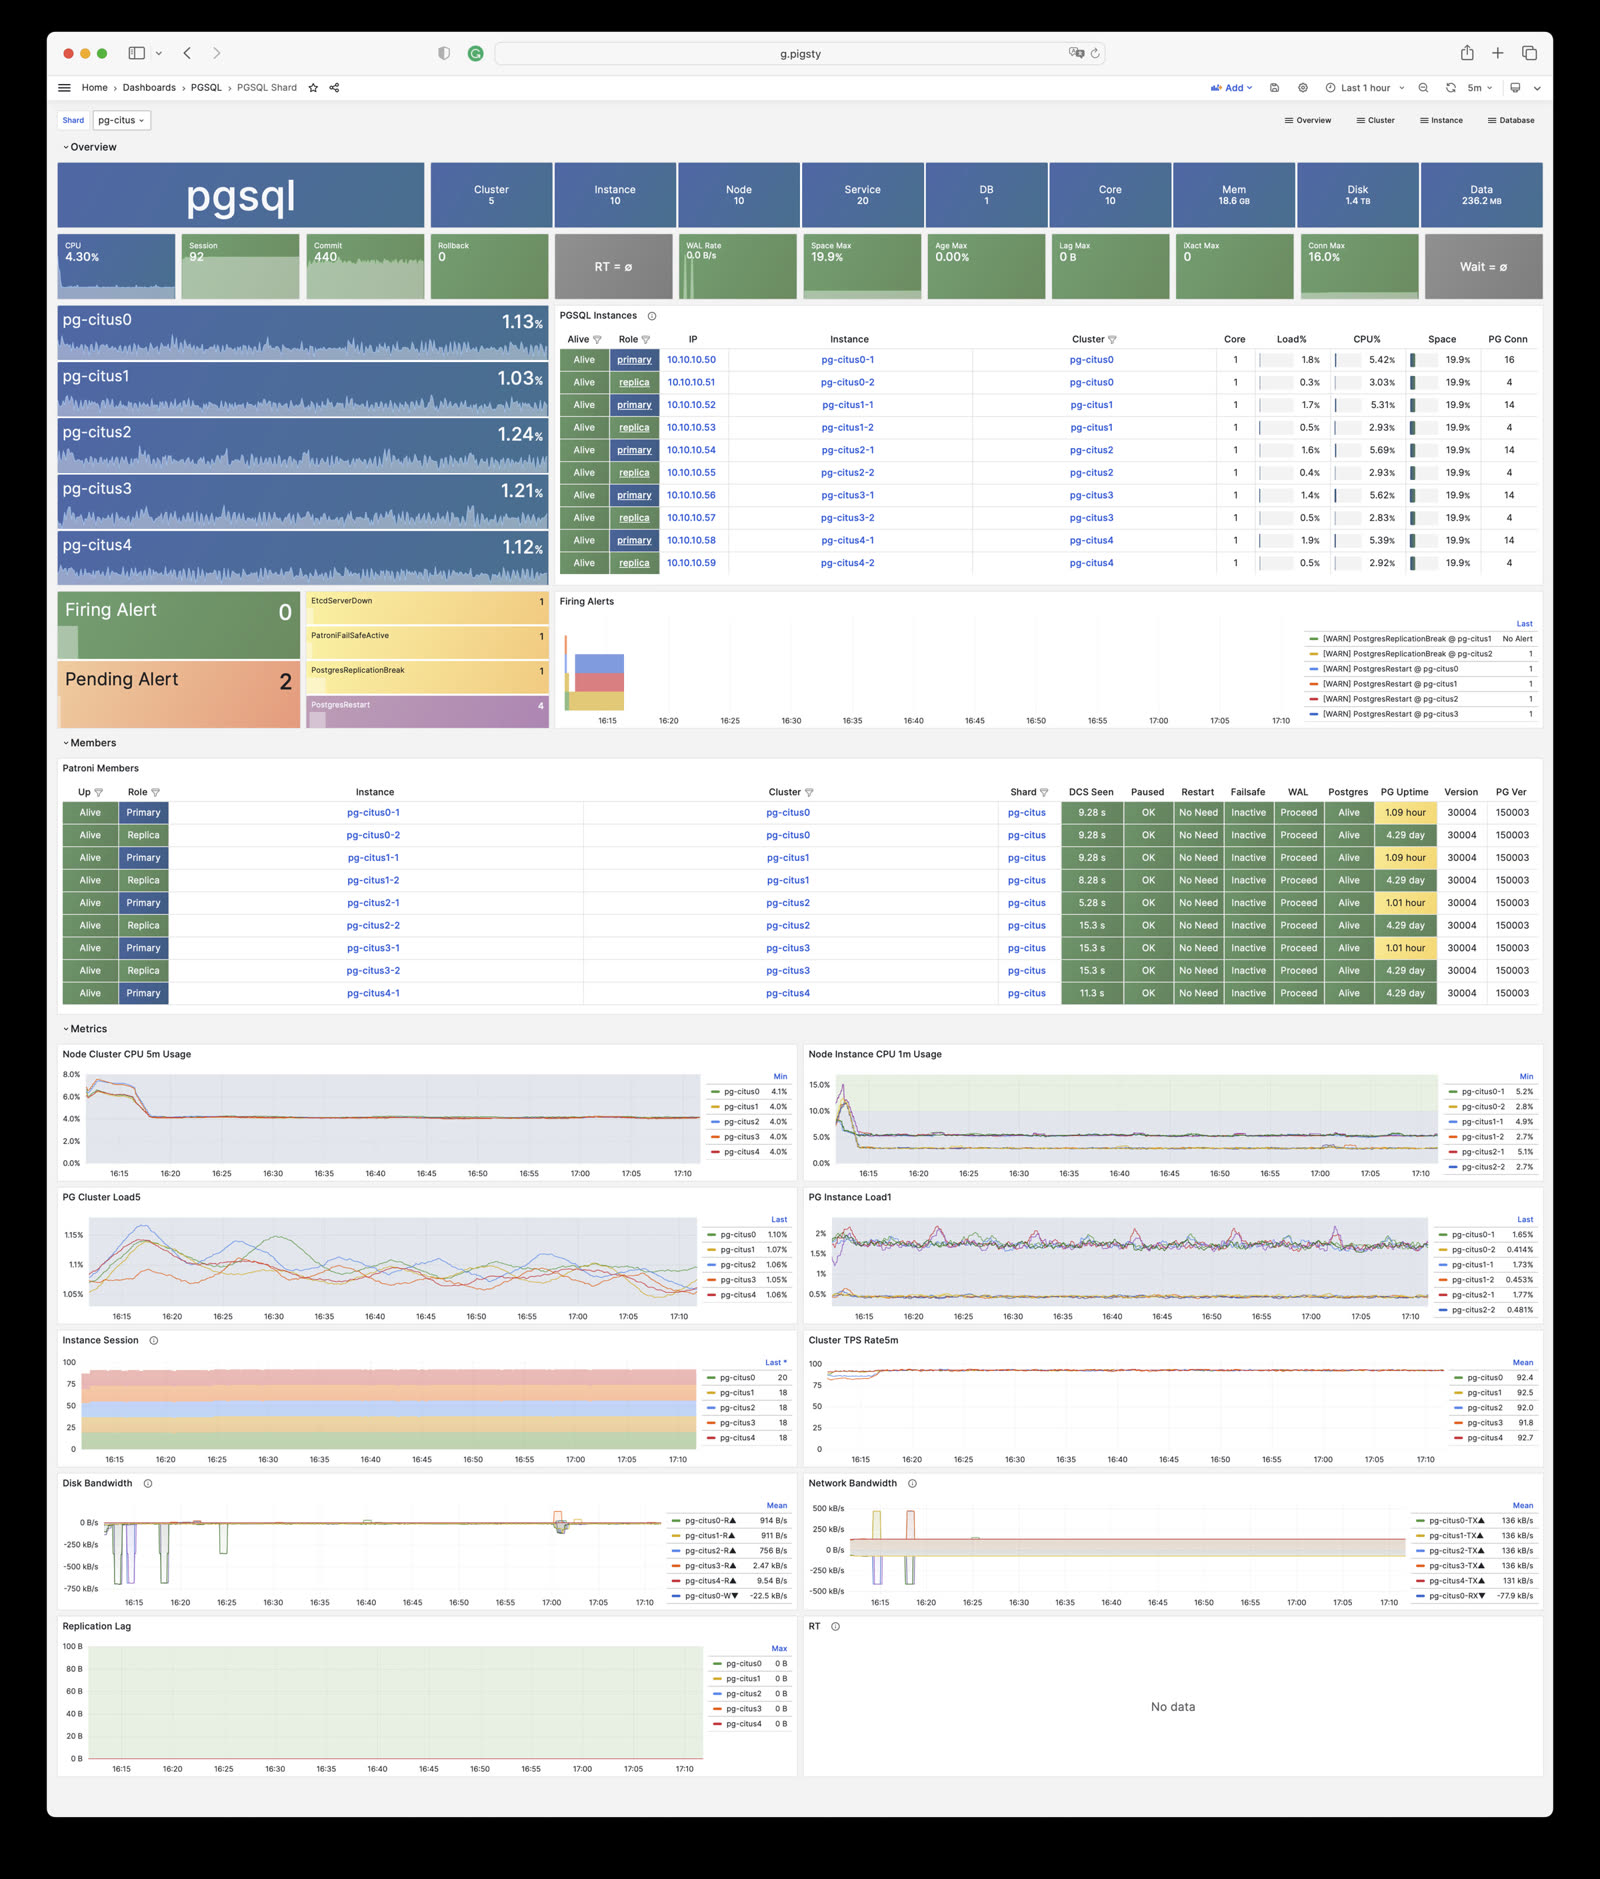
PGSQL Shard: Cross-shard metric comparison for horizontally sharded PGSQL clusters (e.g., CITUS/GPSQL)
Cluster
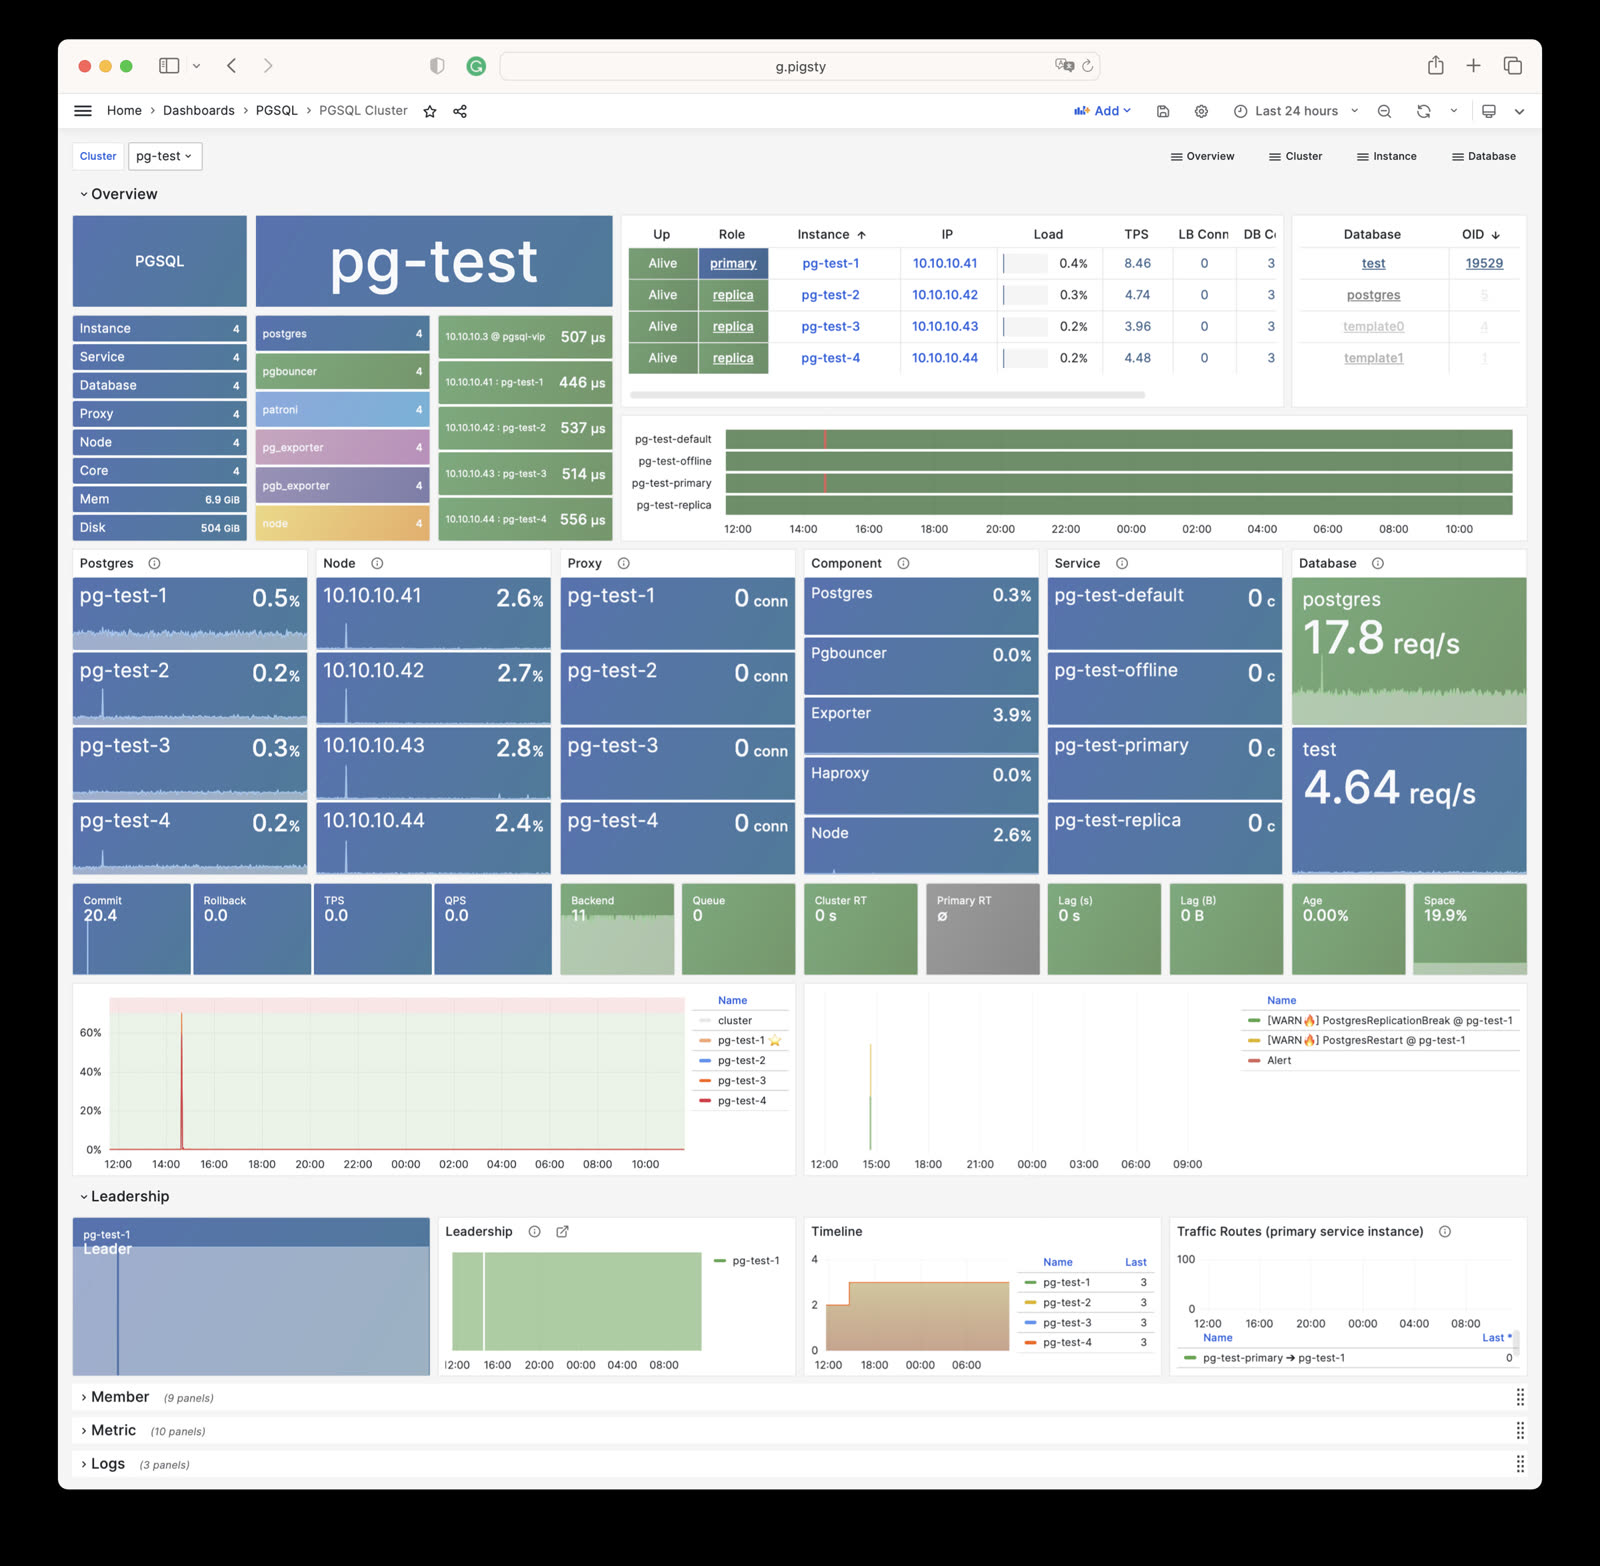
PGSQL Cluster: Main dashboard for a PGSQL cluster
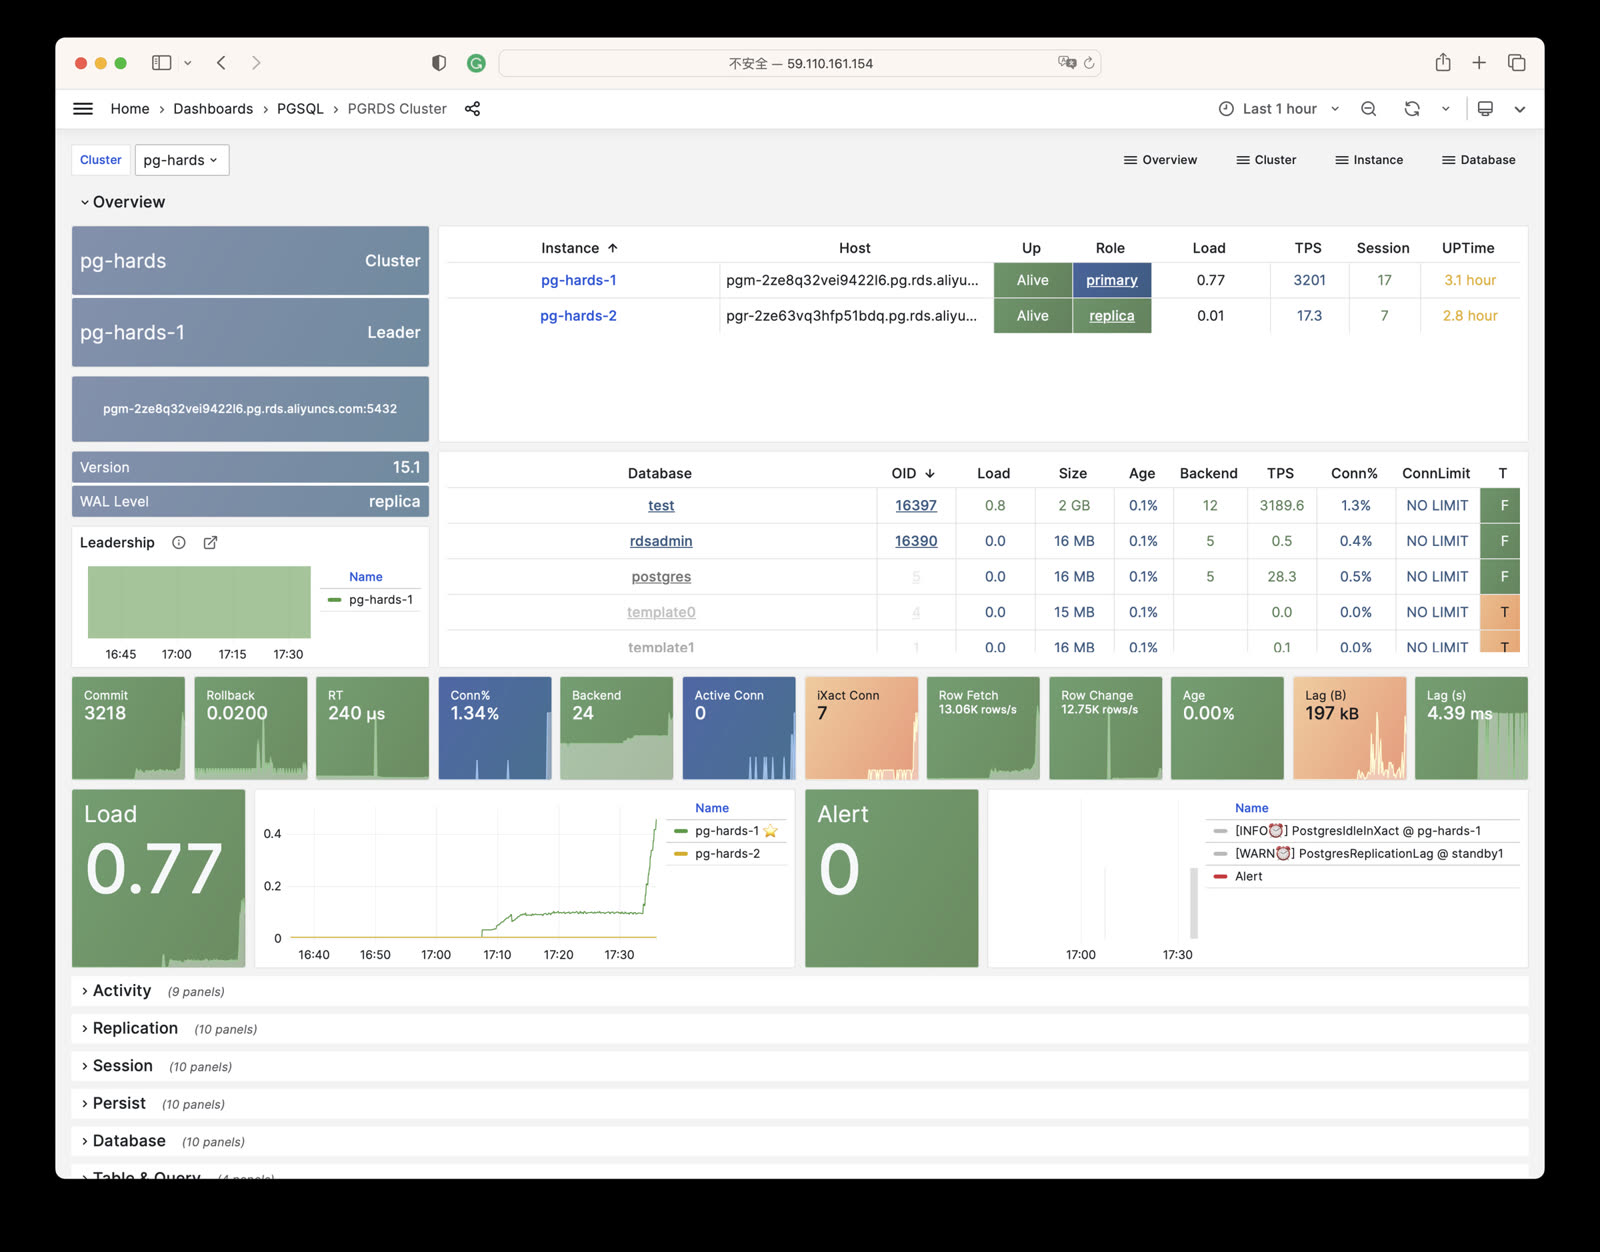
PGRDS Cluster: RDS version of PGSQL Cluster, focusing on PostgreSQL-native metrics
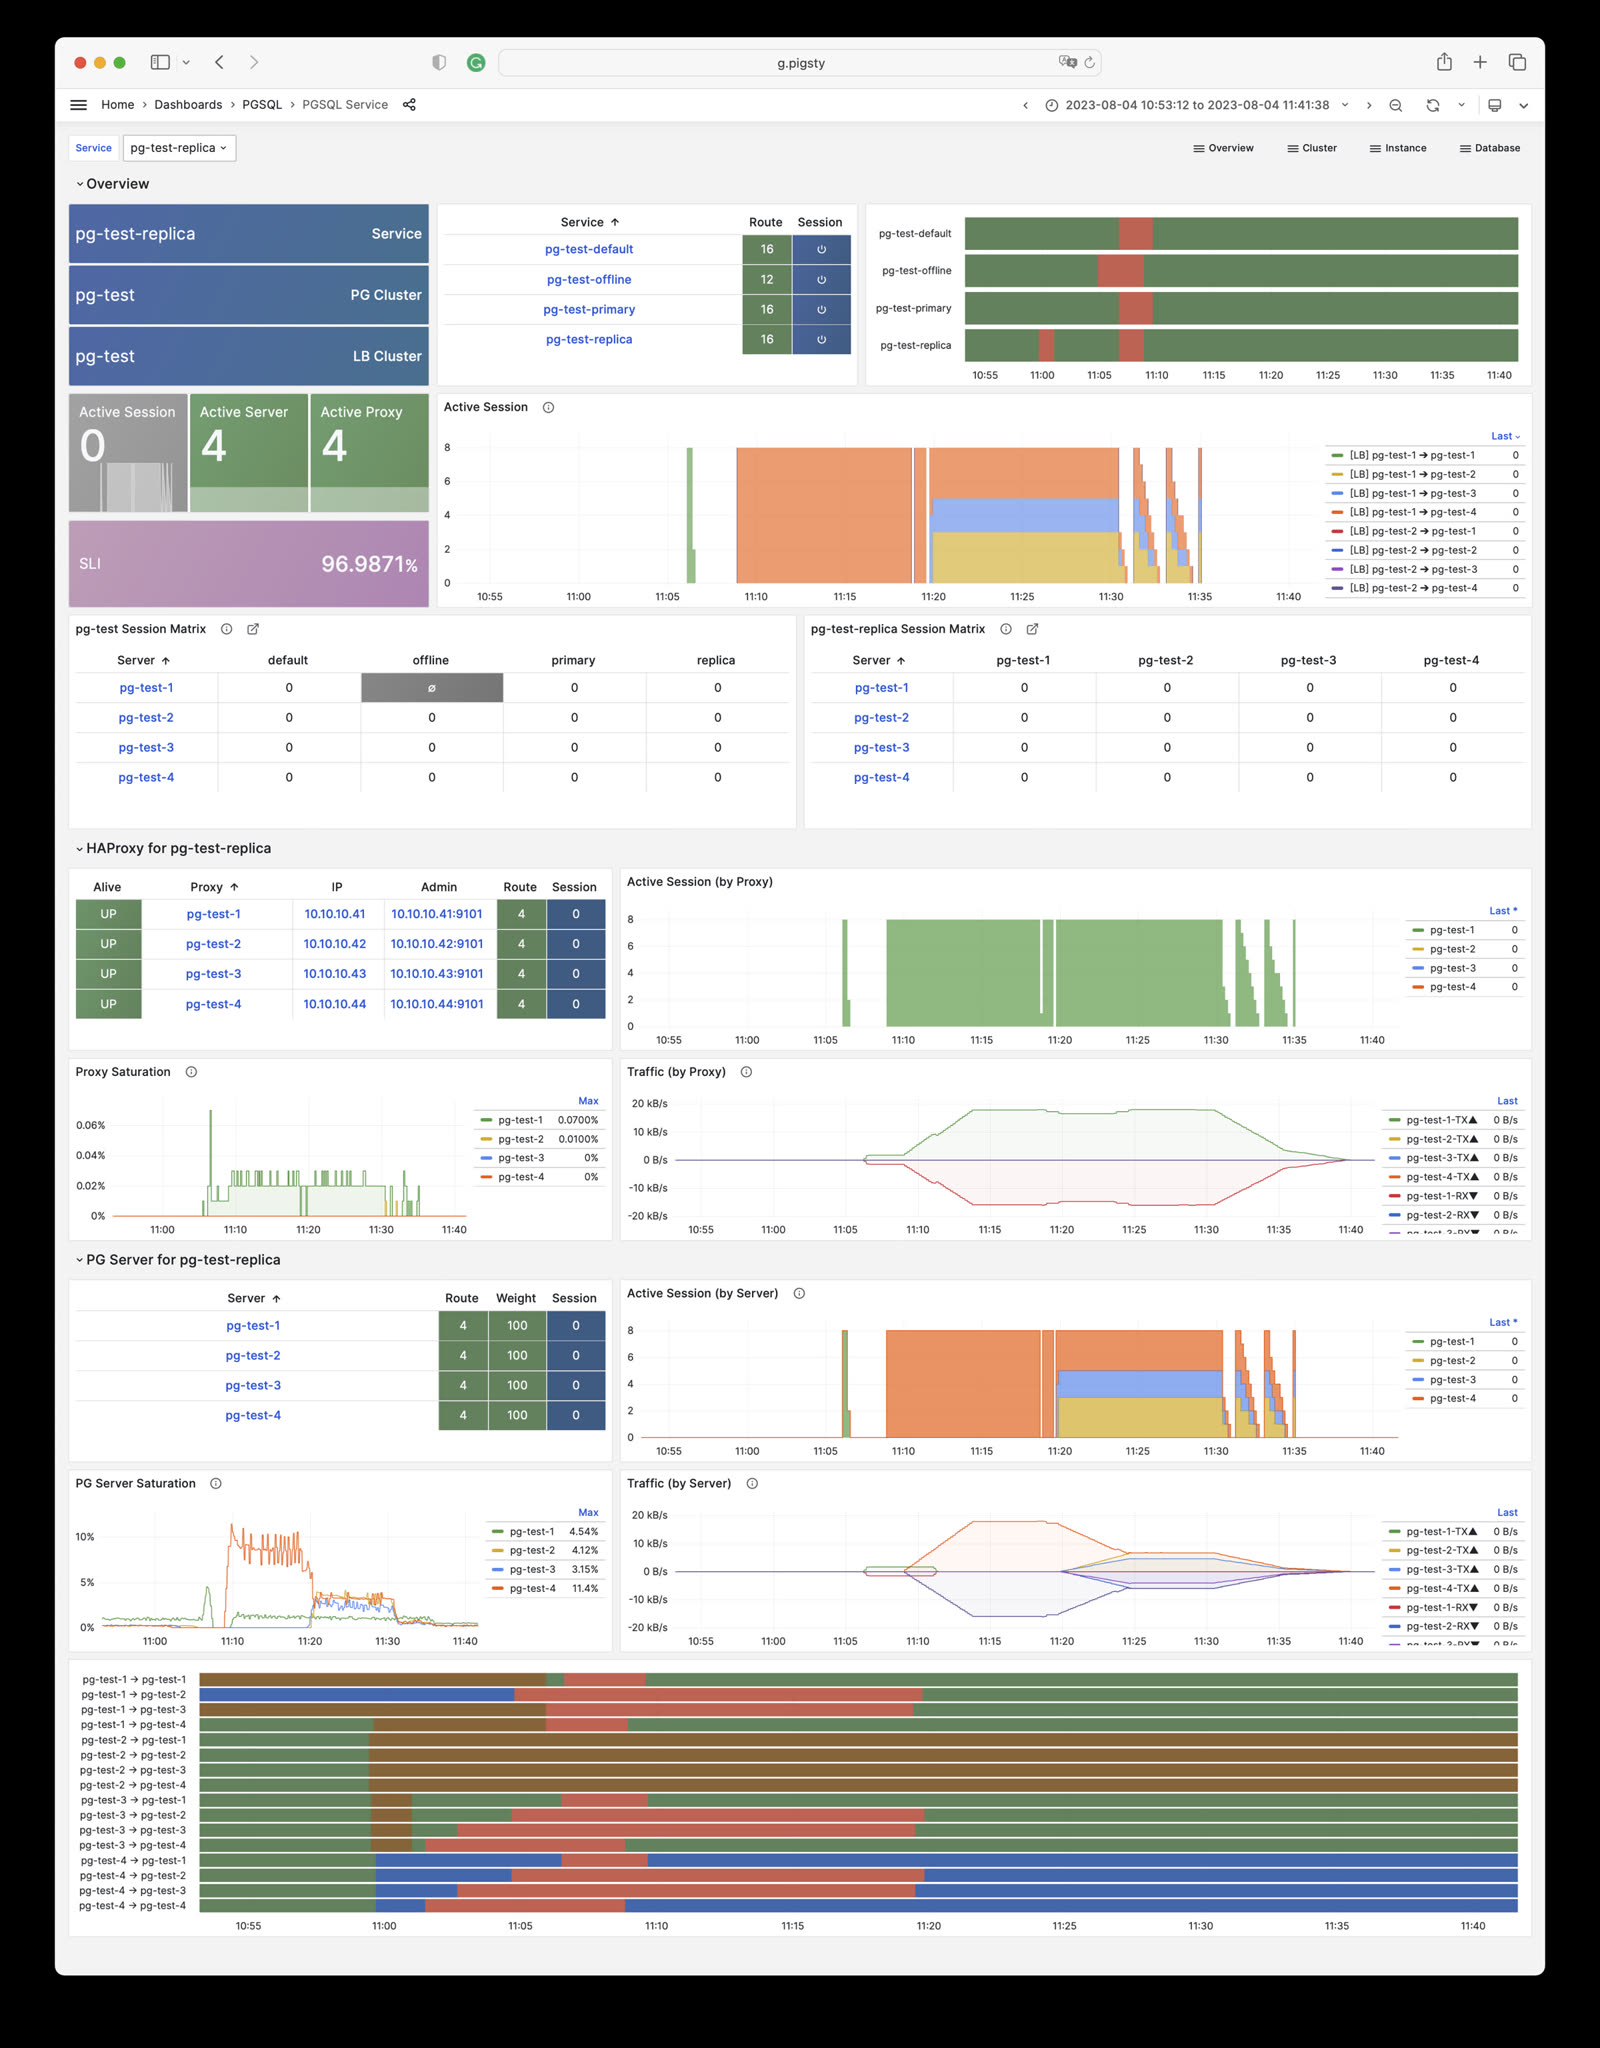
PGSQL Service: Service, proxy, routing, and load balancing for PGSQL cluster
PGSQL Activity: Session/load/QPS/TPS/locks for PGSQL cluster
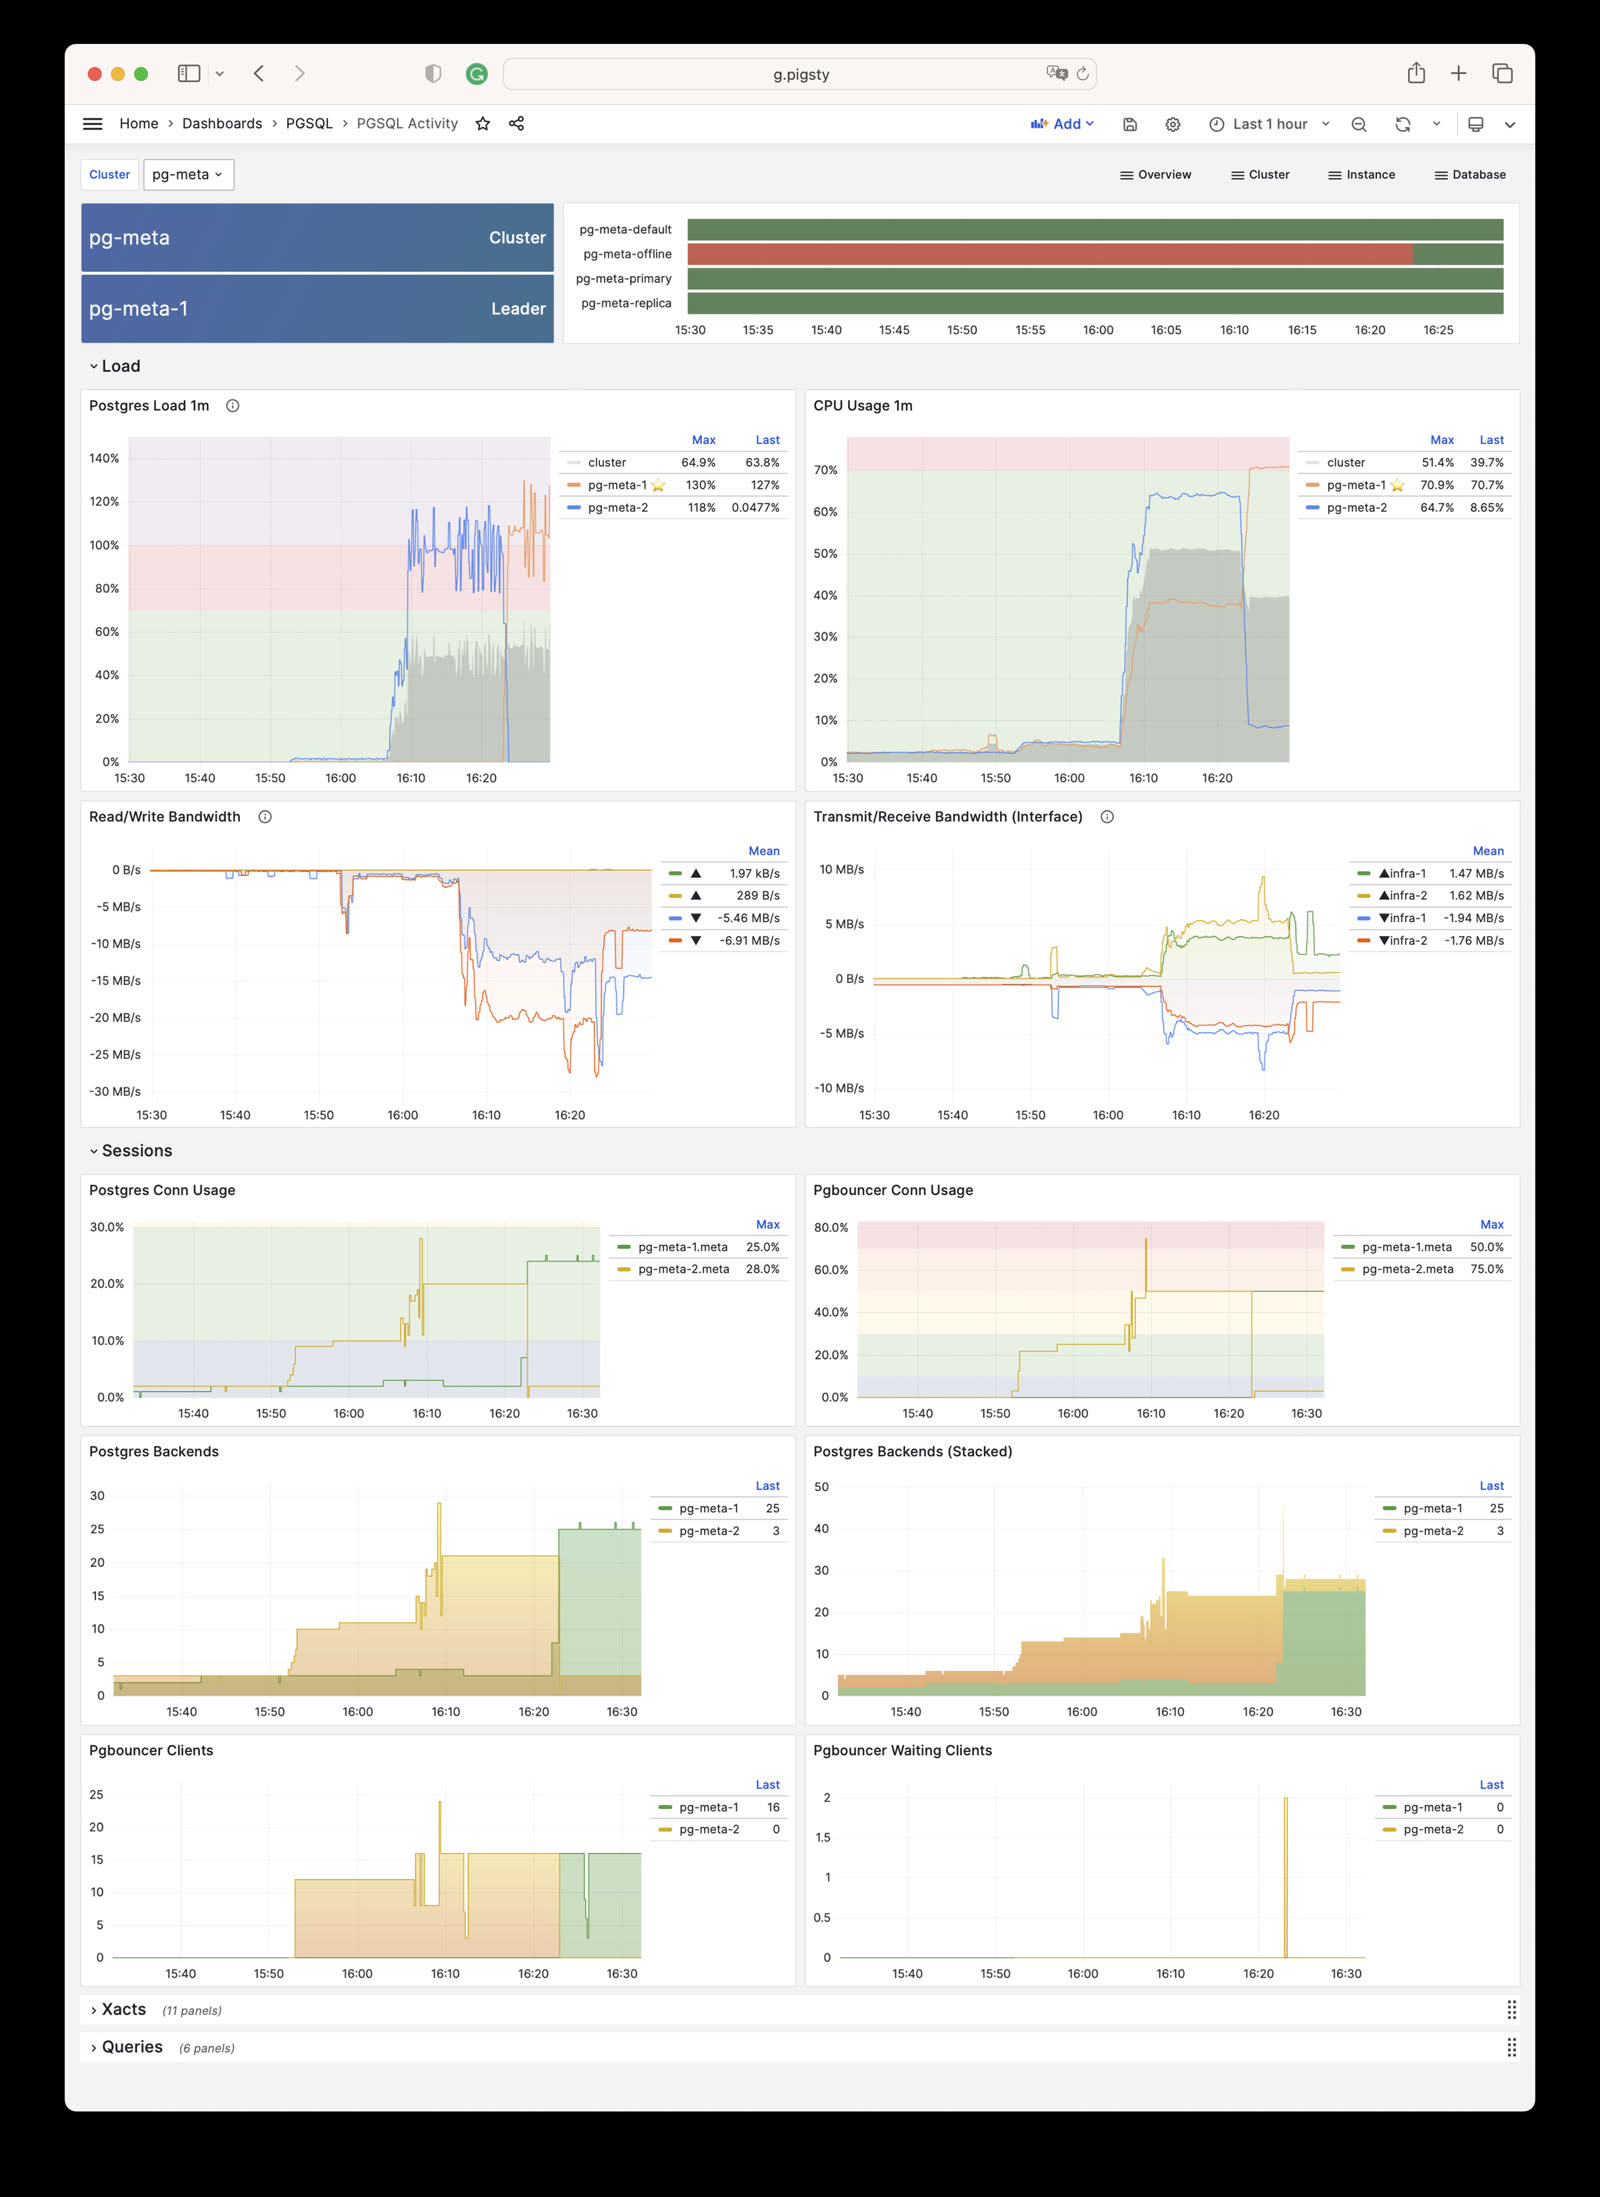
PGSQL Replication: Replication, slots, and pub/sub for PGSQL cluster
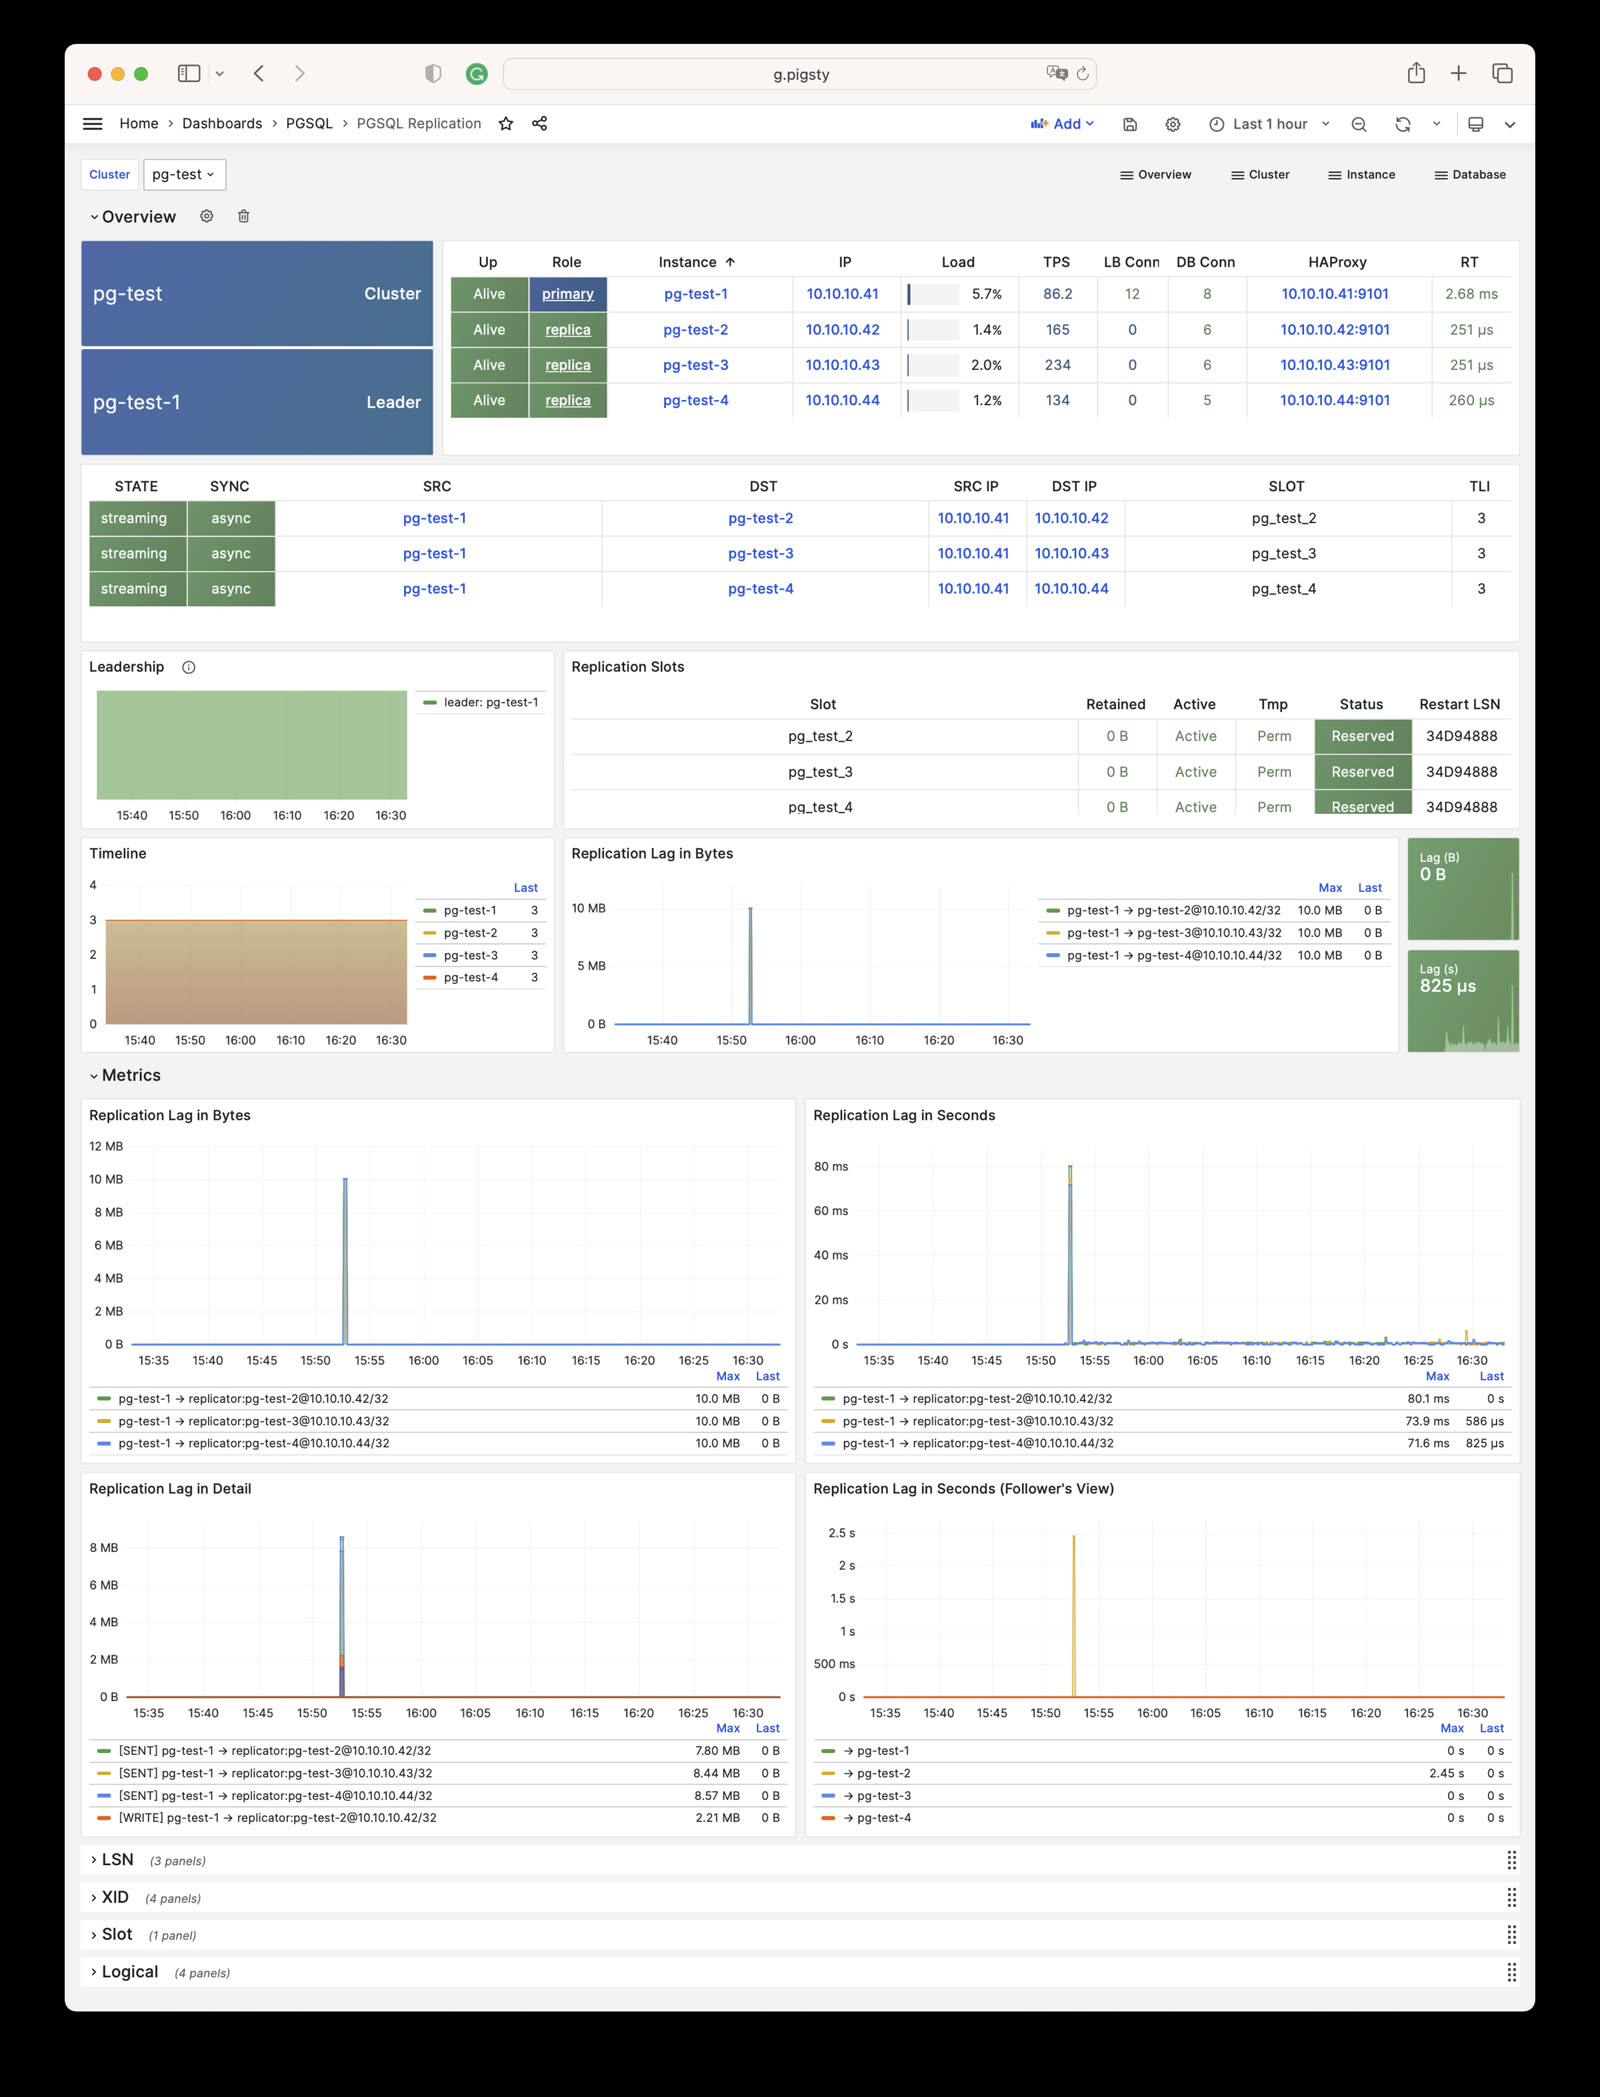
PGSQL Databases: Database CRUD, slow queries, and table statistics across all instances
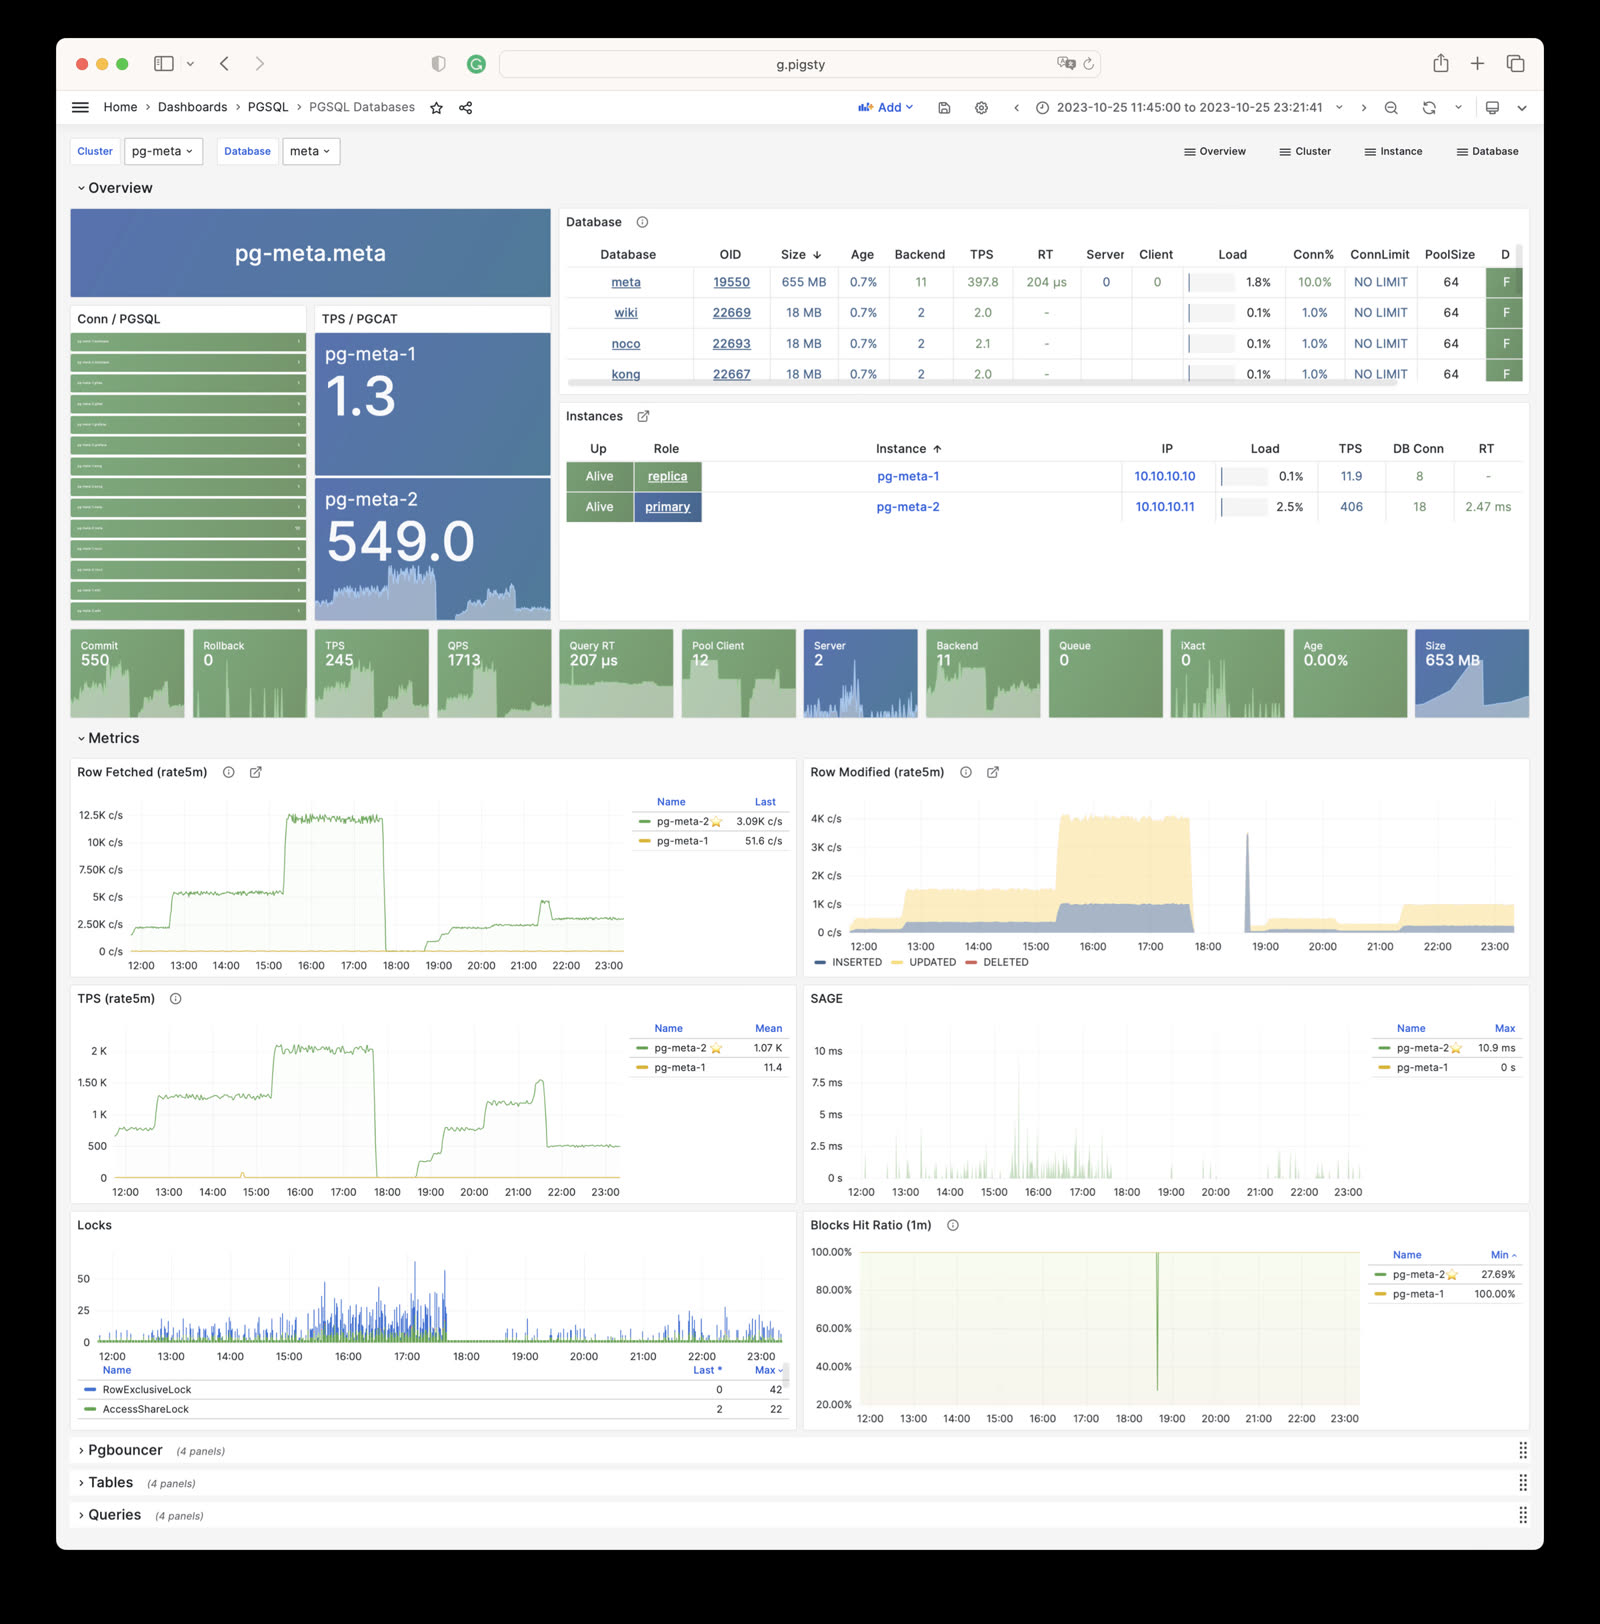
PGSQL Patroni: HA status and Patroni component status for cluster
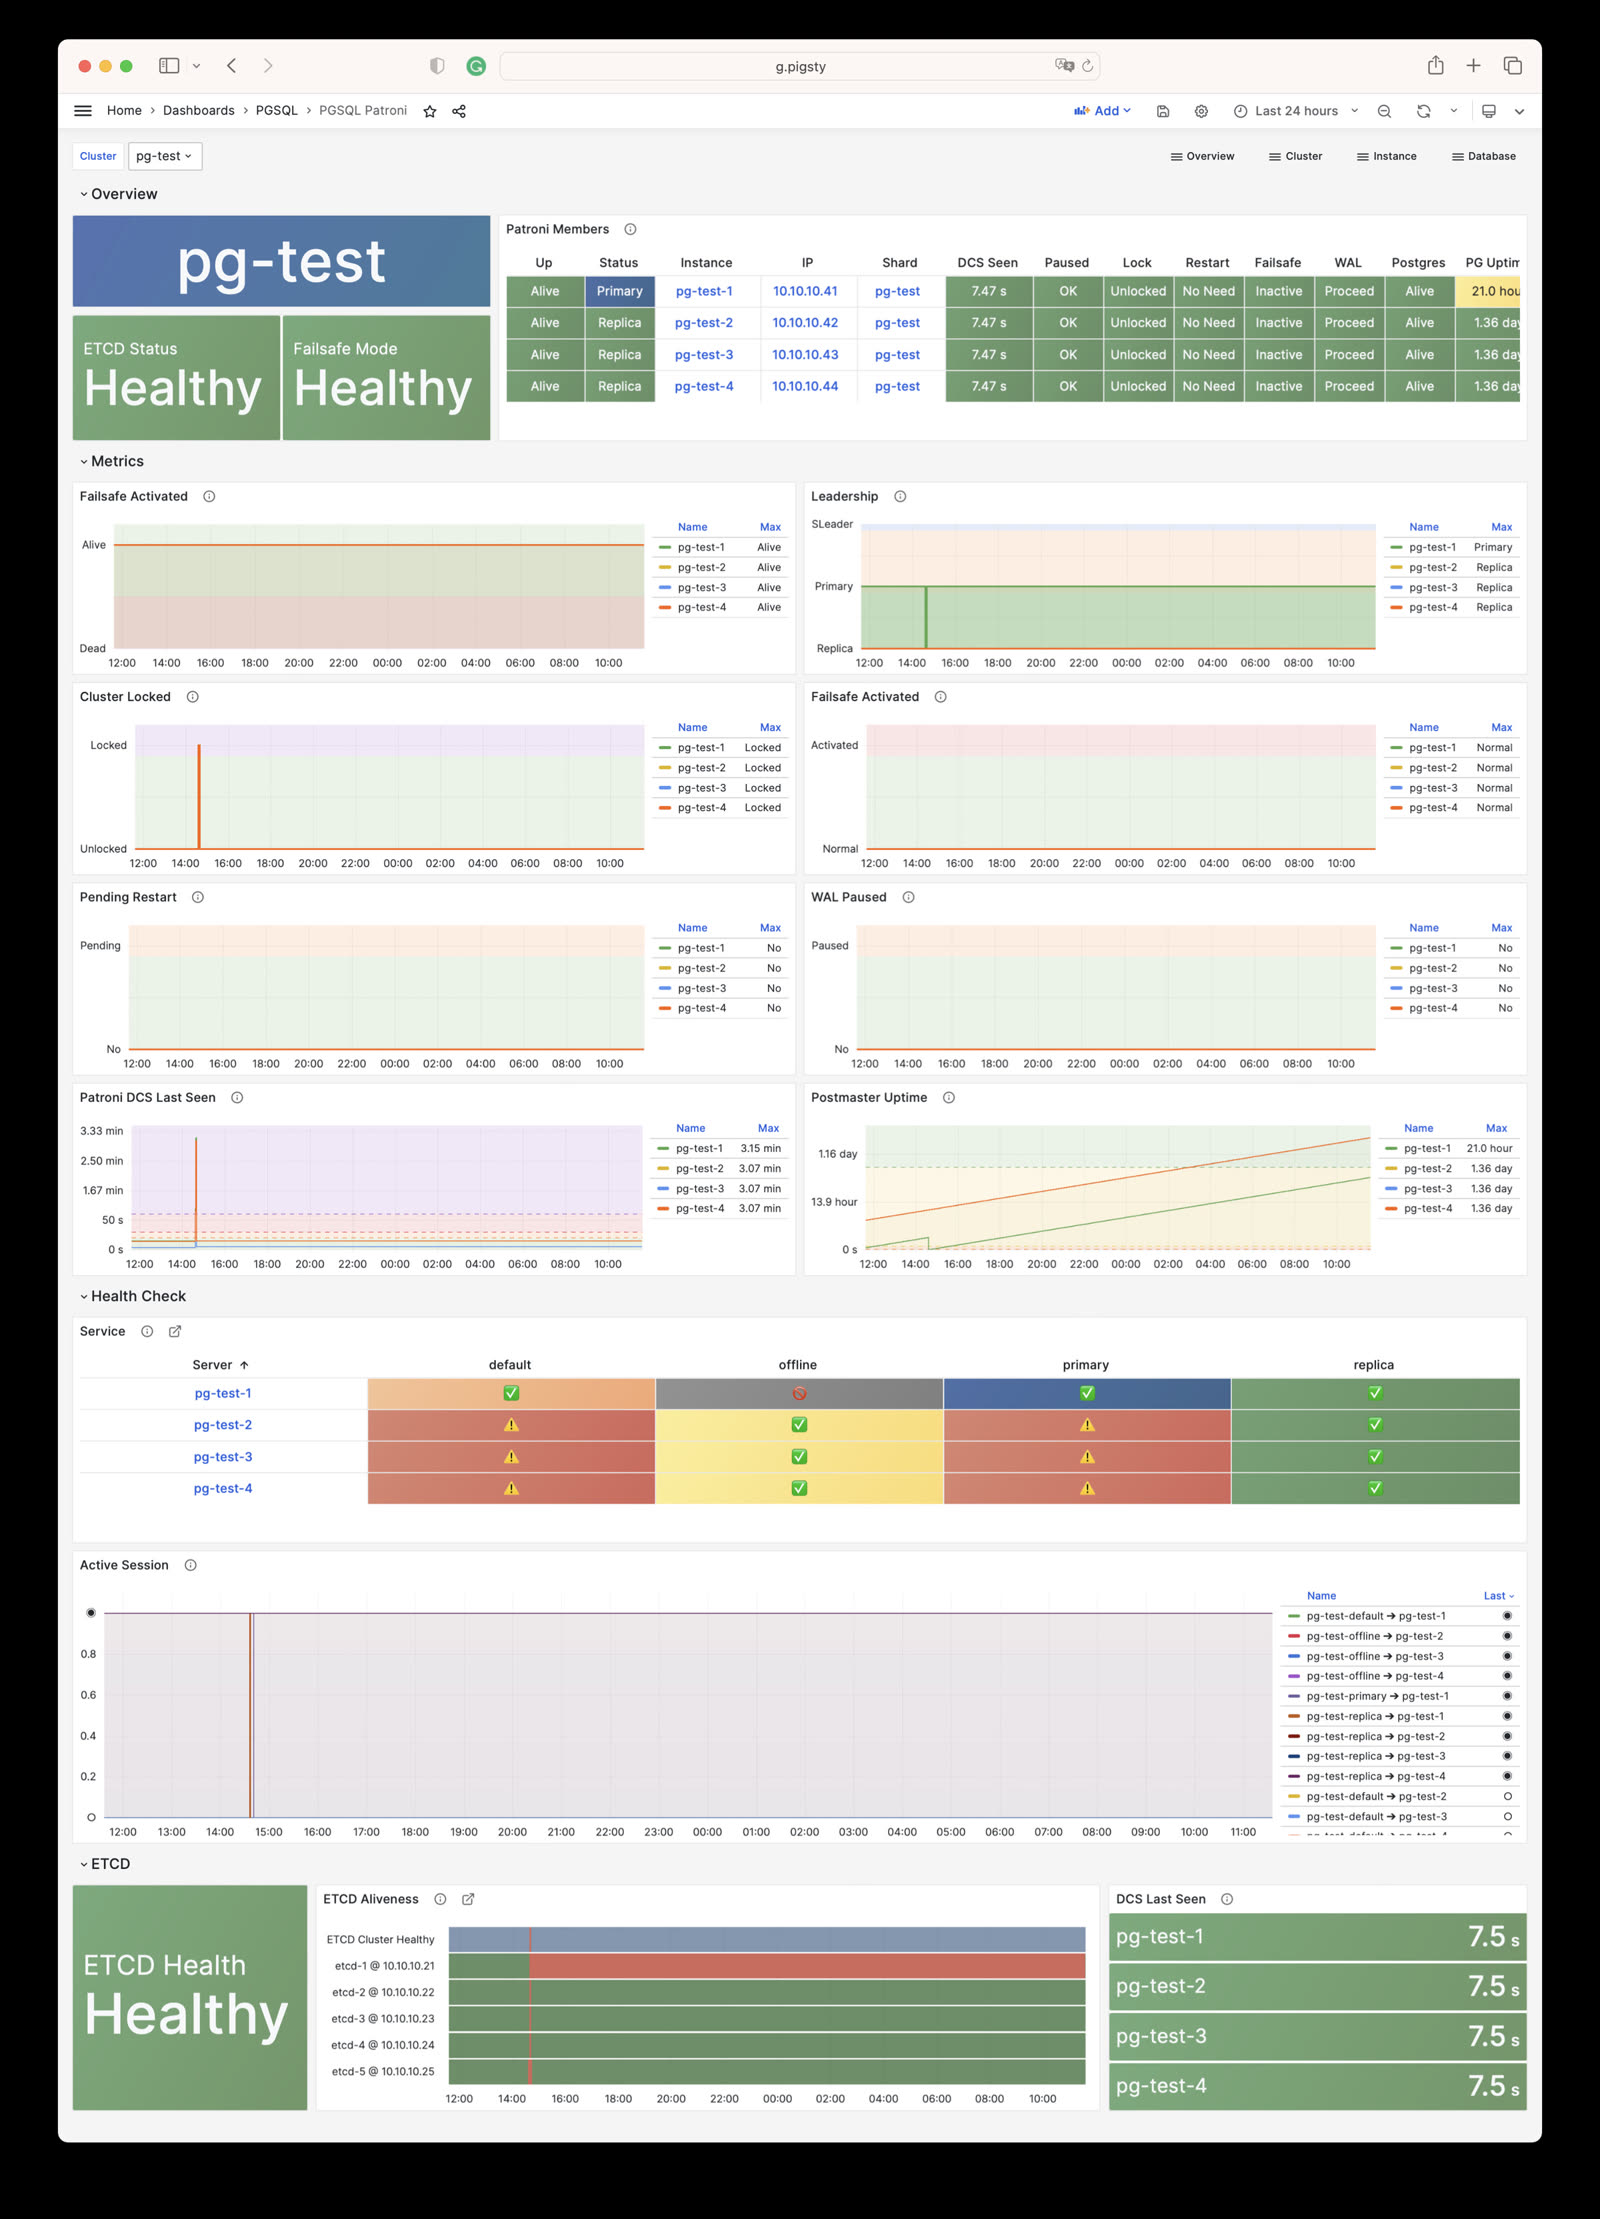
PGSQL PITR: PITR context for point-in-time recovery assistance
Instance
PGSQL Instance: Main dashboard for a single PGSQL instance
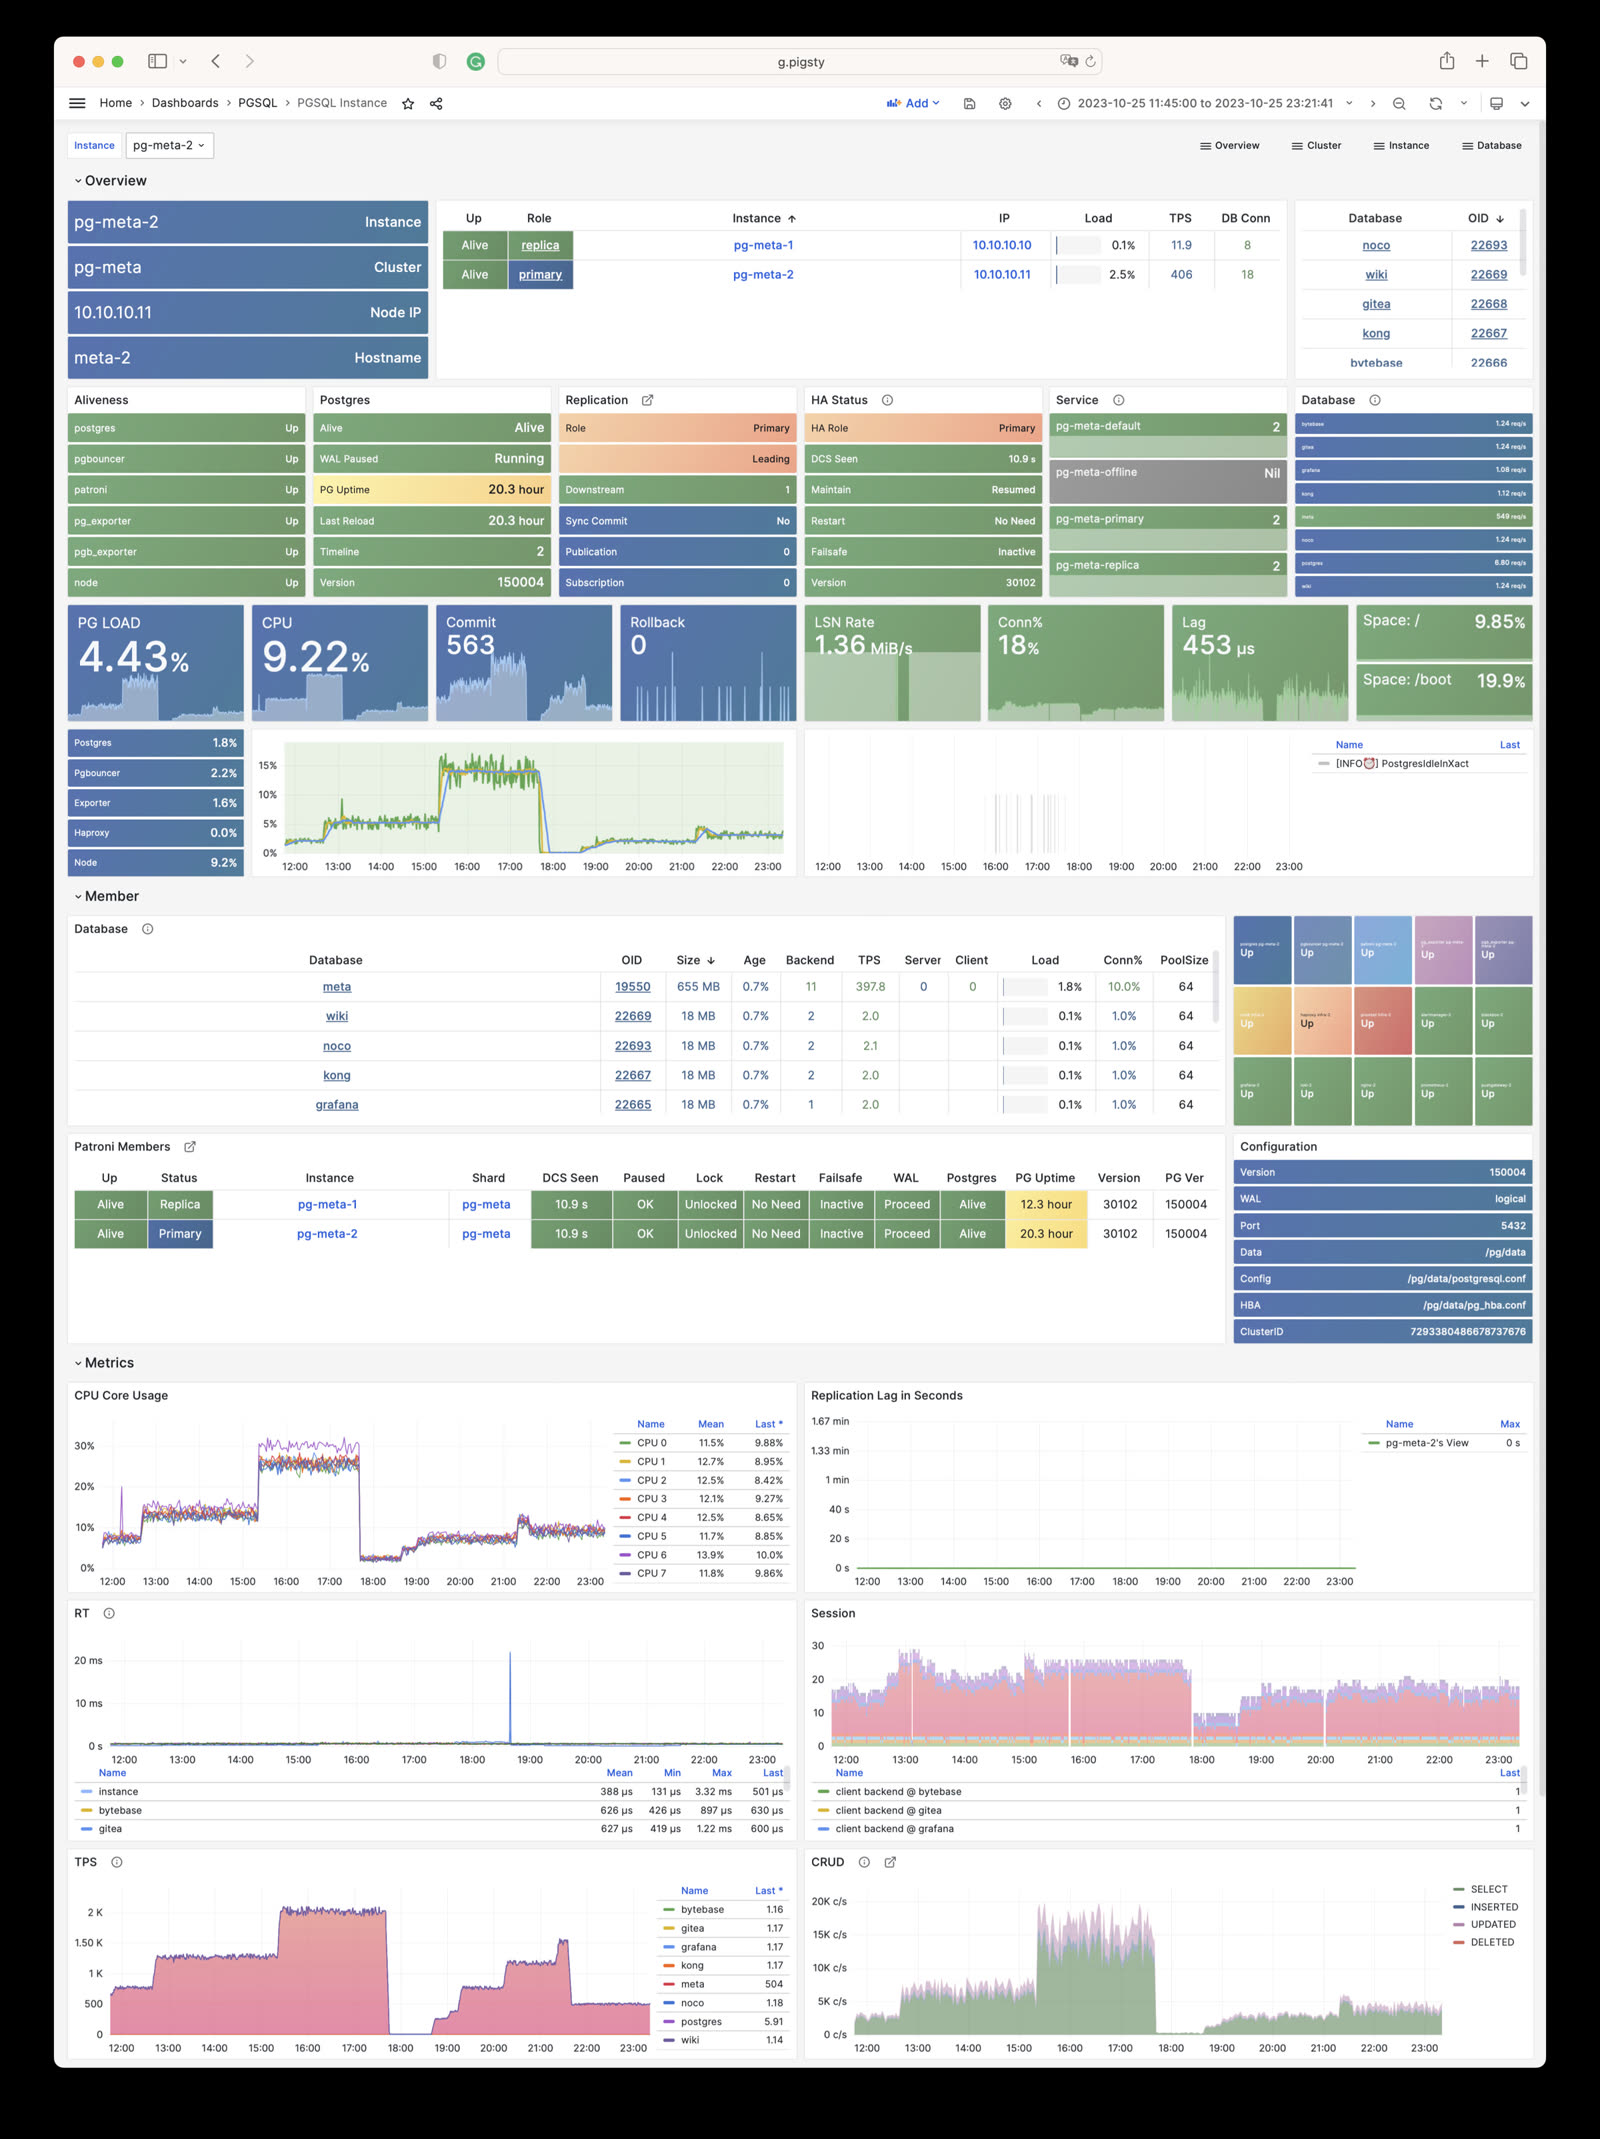
PGRDS Instance: RDS version of PGSQL Instance, focusing on PostgreSQL-native metrics
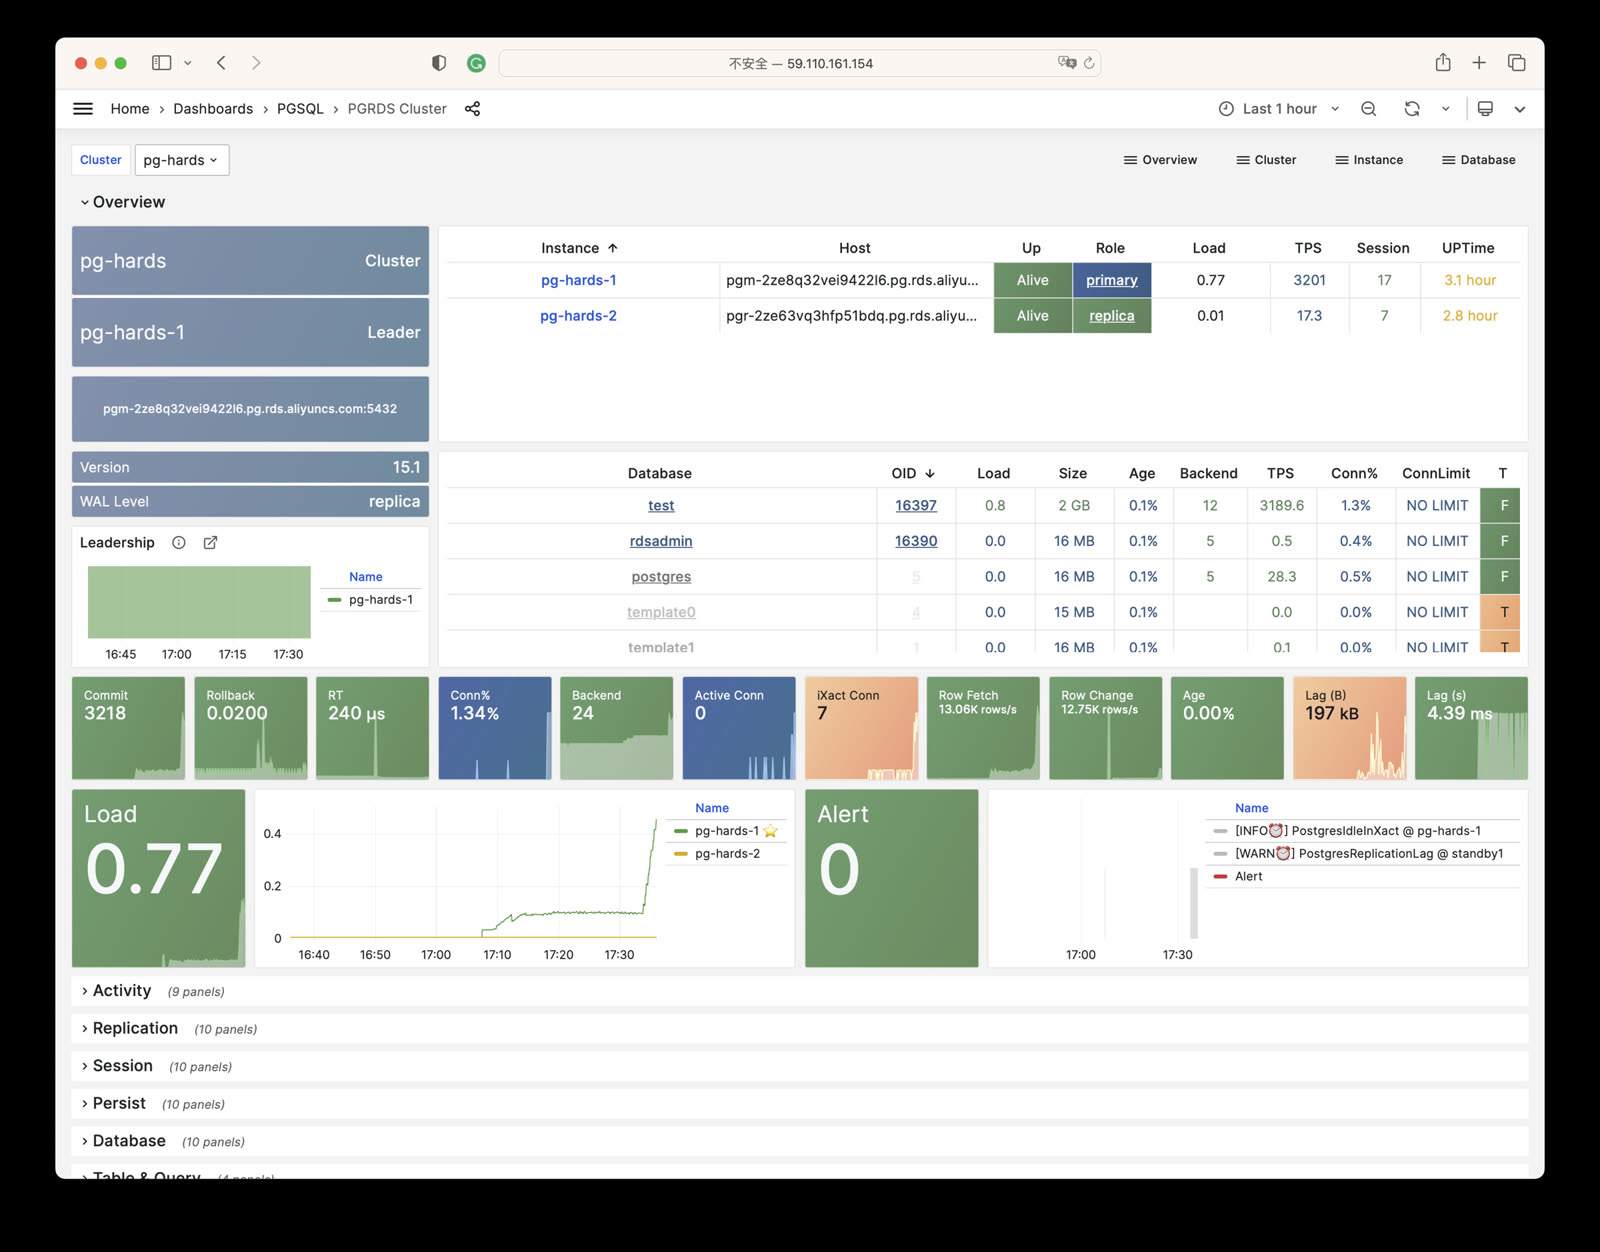
PGSQL Proxy: Detailed metrics for a single HAProxy load balancer
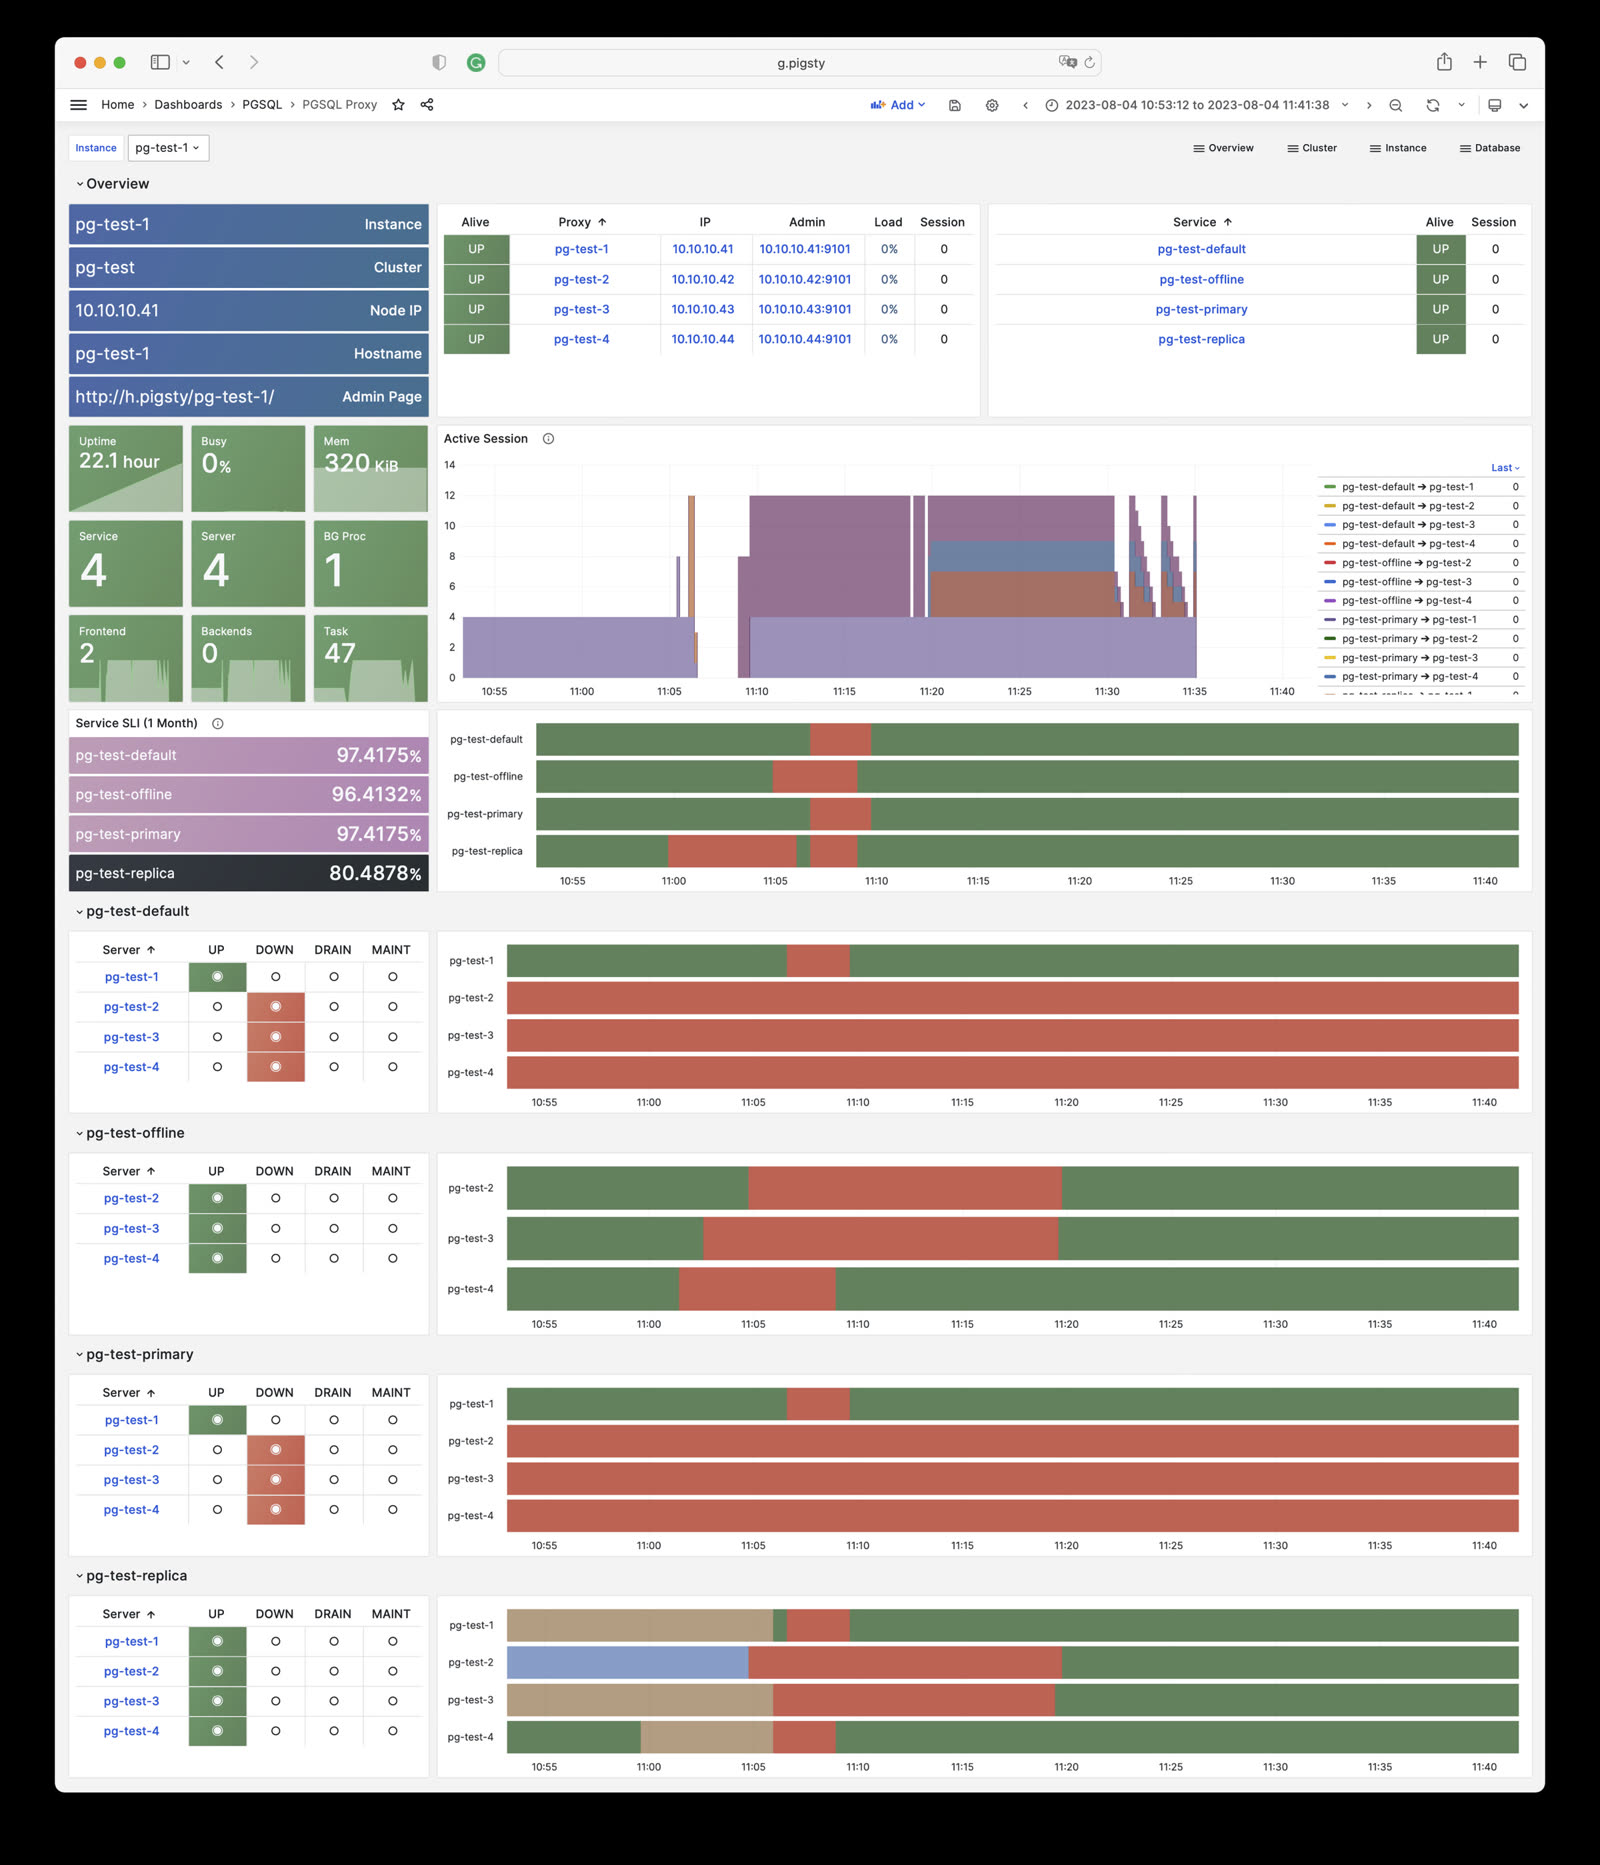
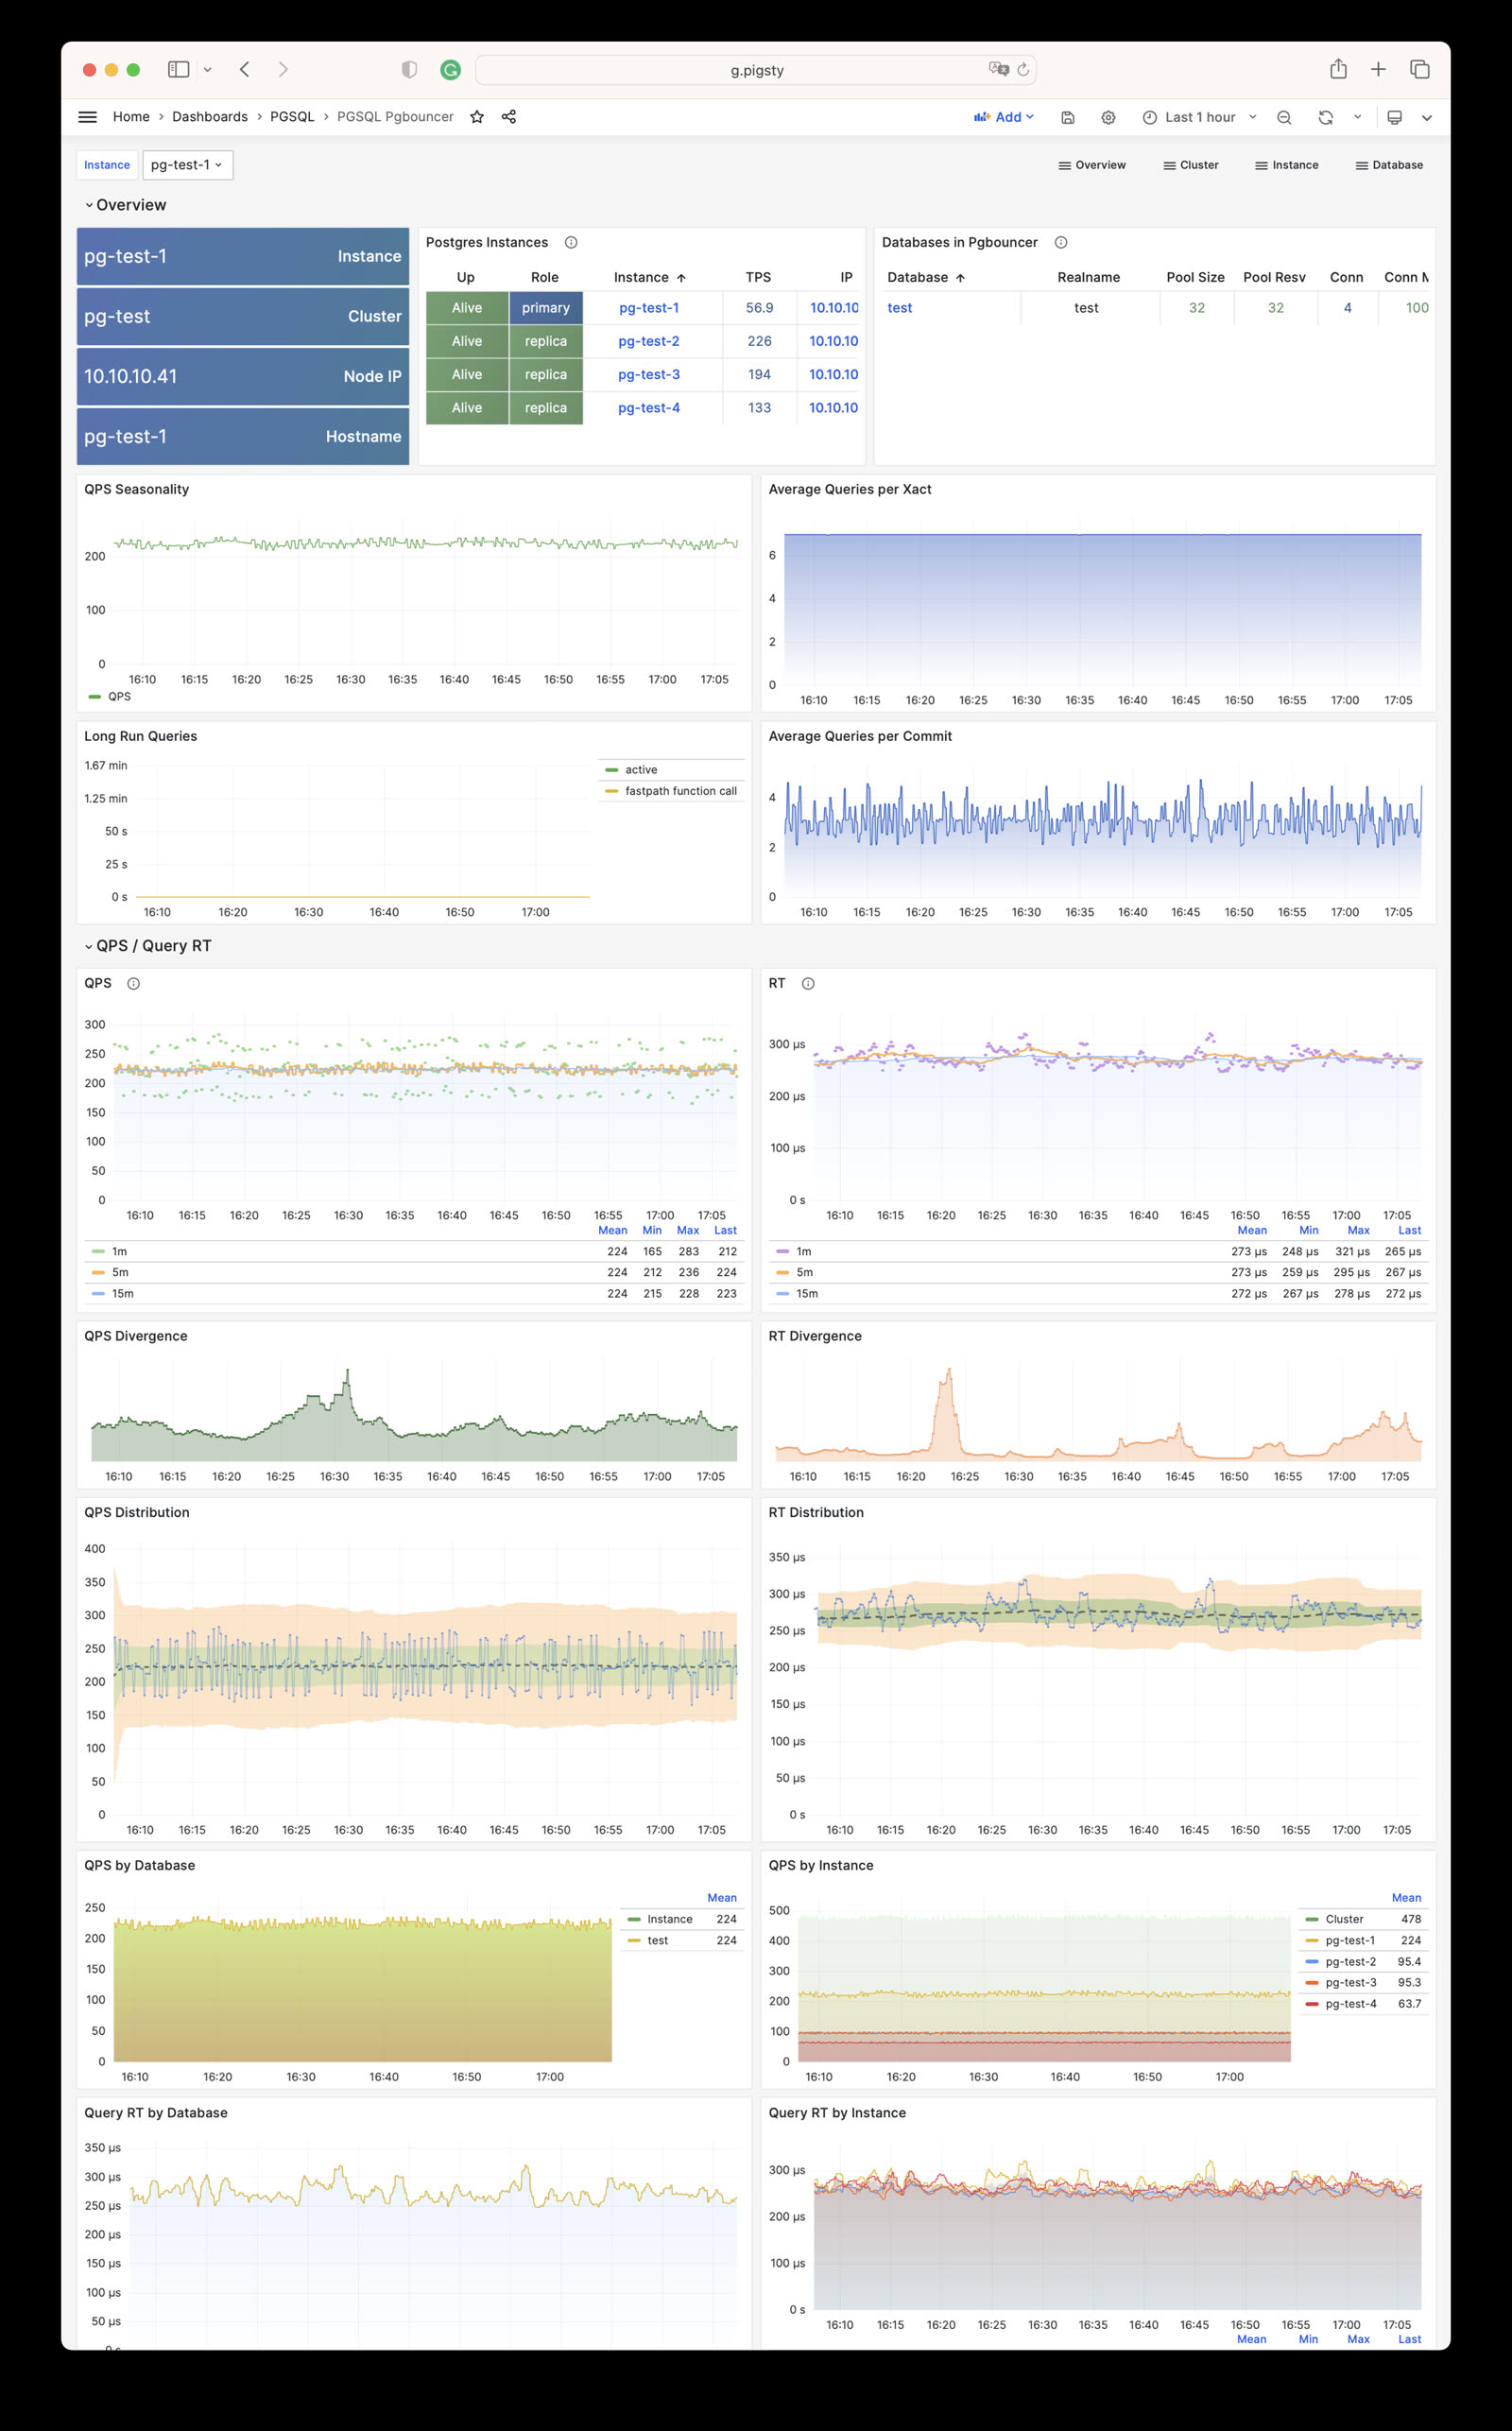
PGSQL Pgbouncer: Metrics overview for a single Pgbouncer connection pooler
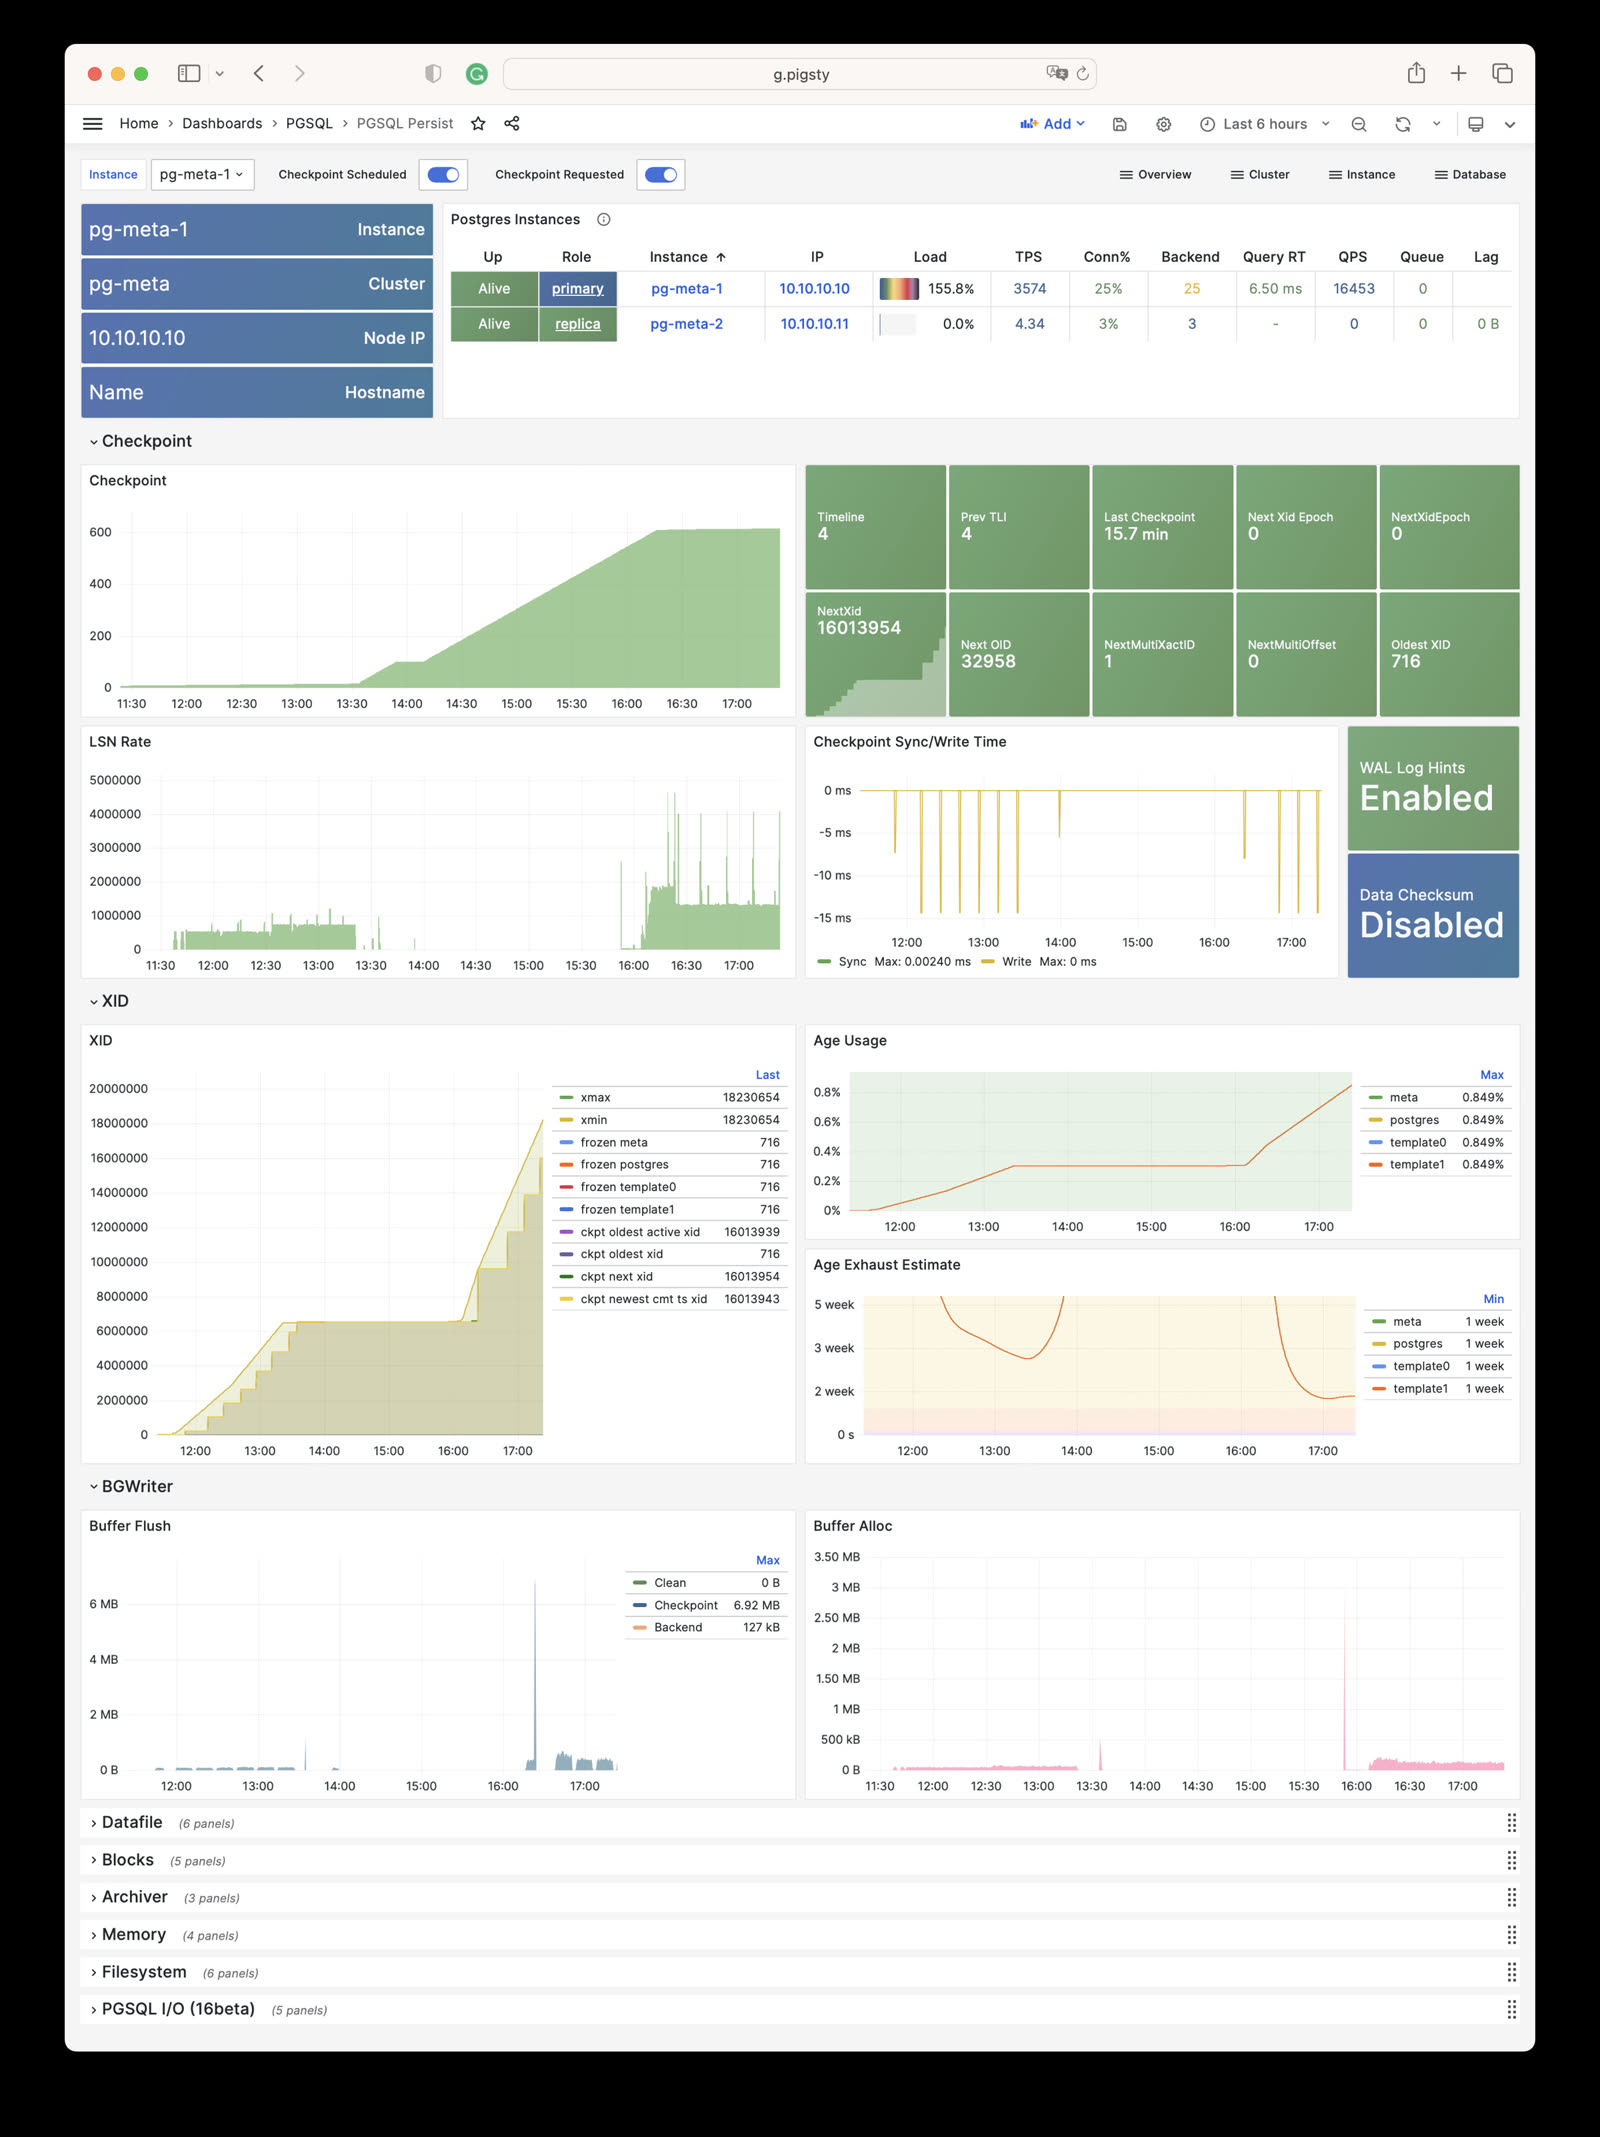
PGSQL Persist: Persistence metrics: WAL, XID, checkpoint, archive, IO
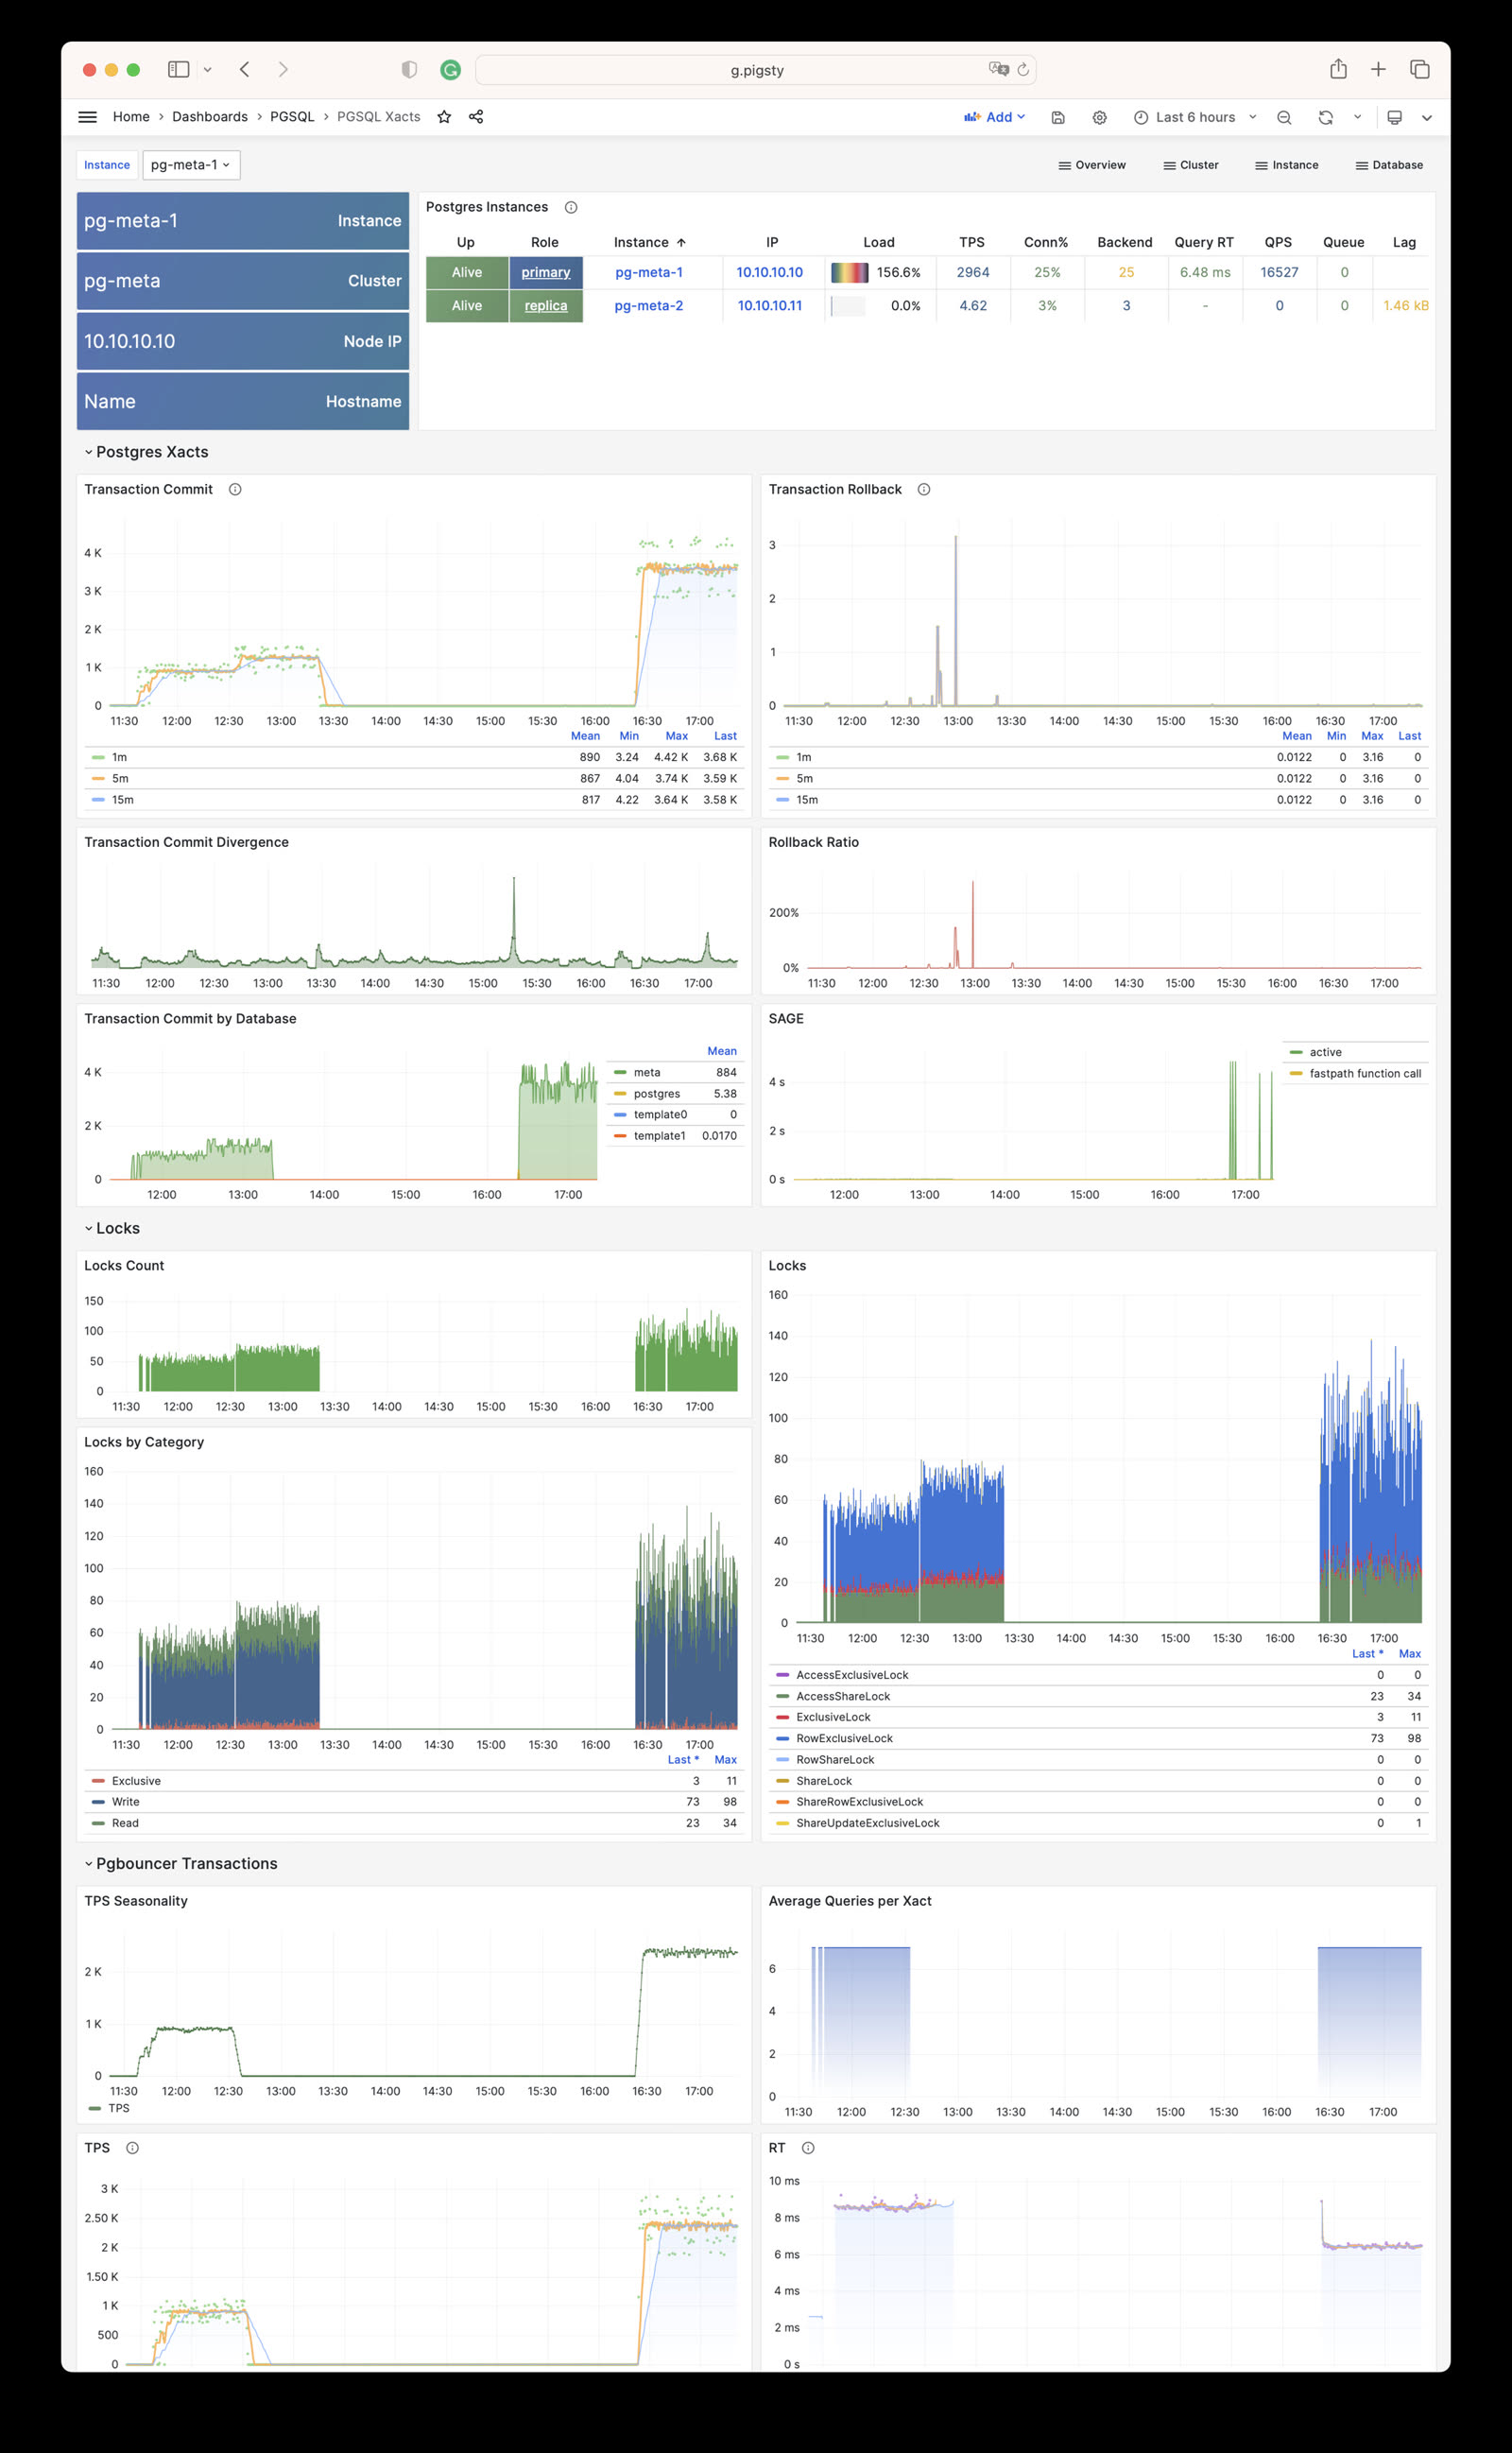
PGSQL Xacts: Transaction, lock, TPS/QPS related metrics
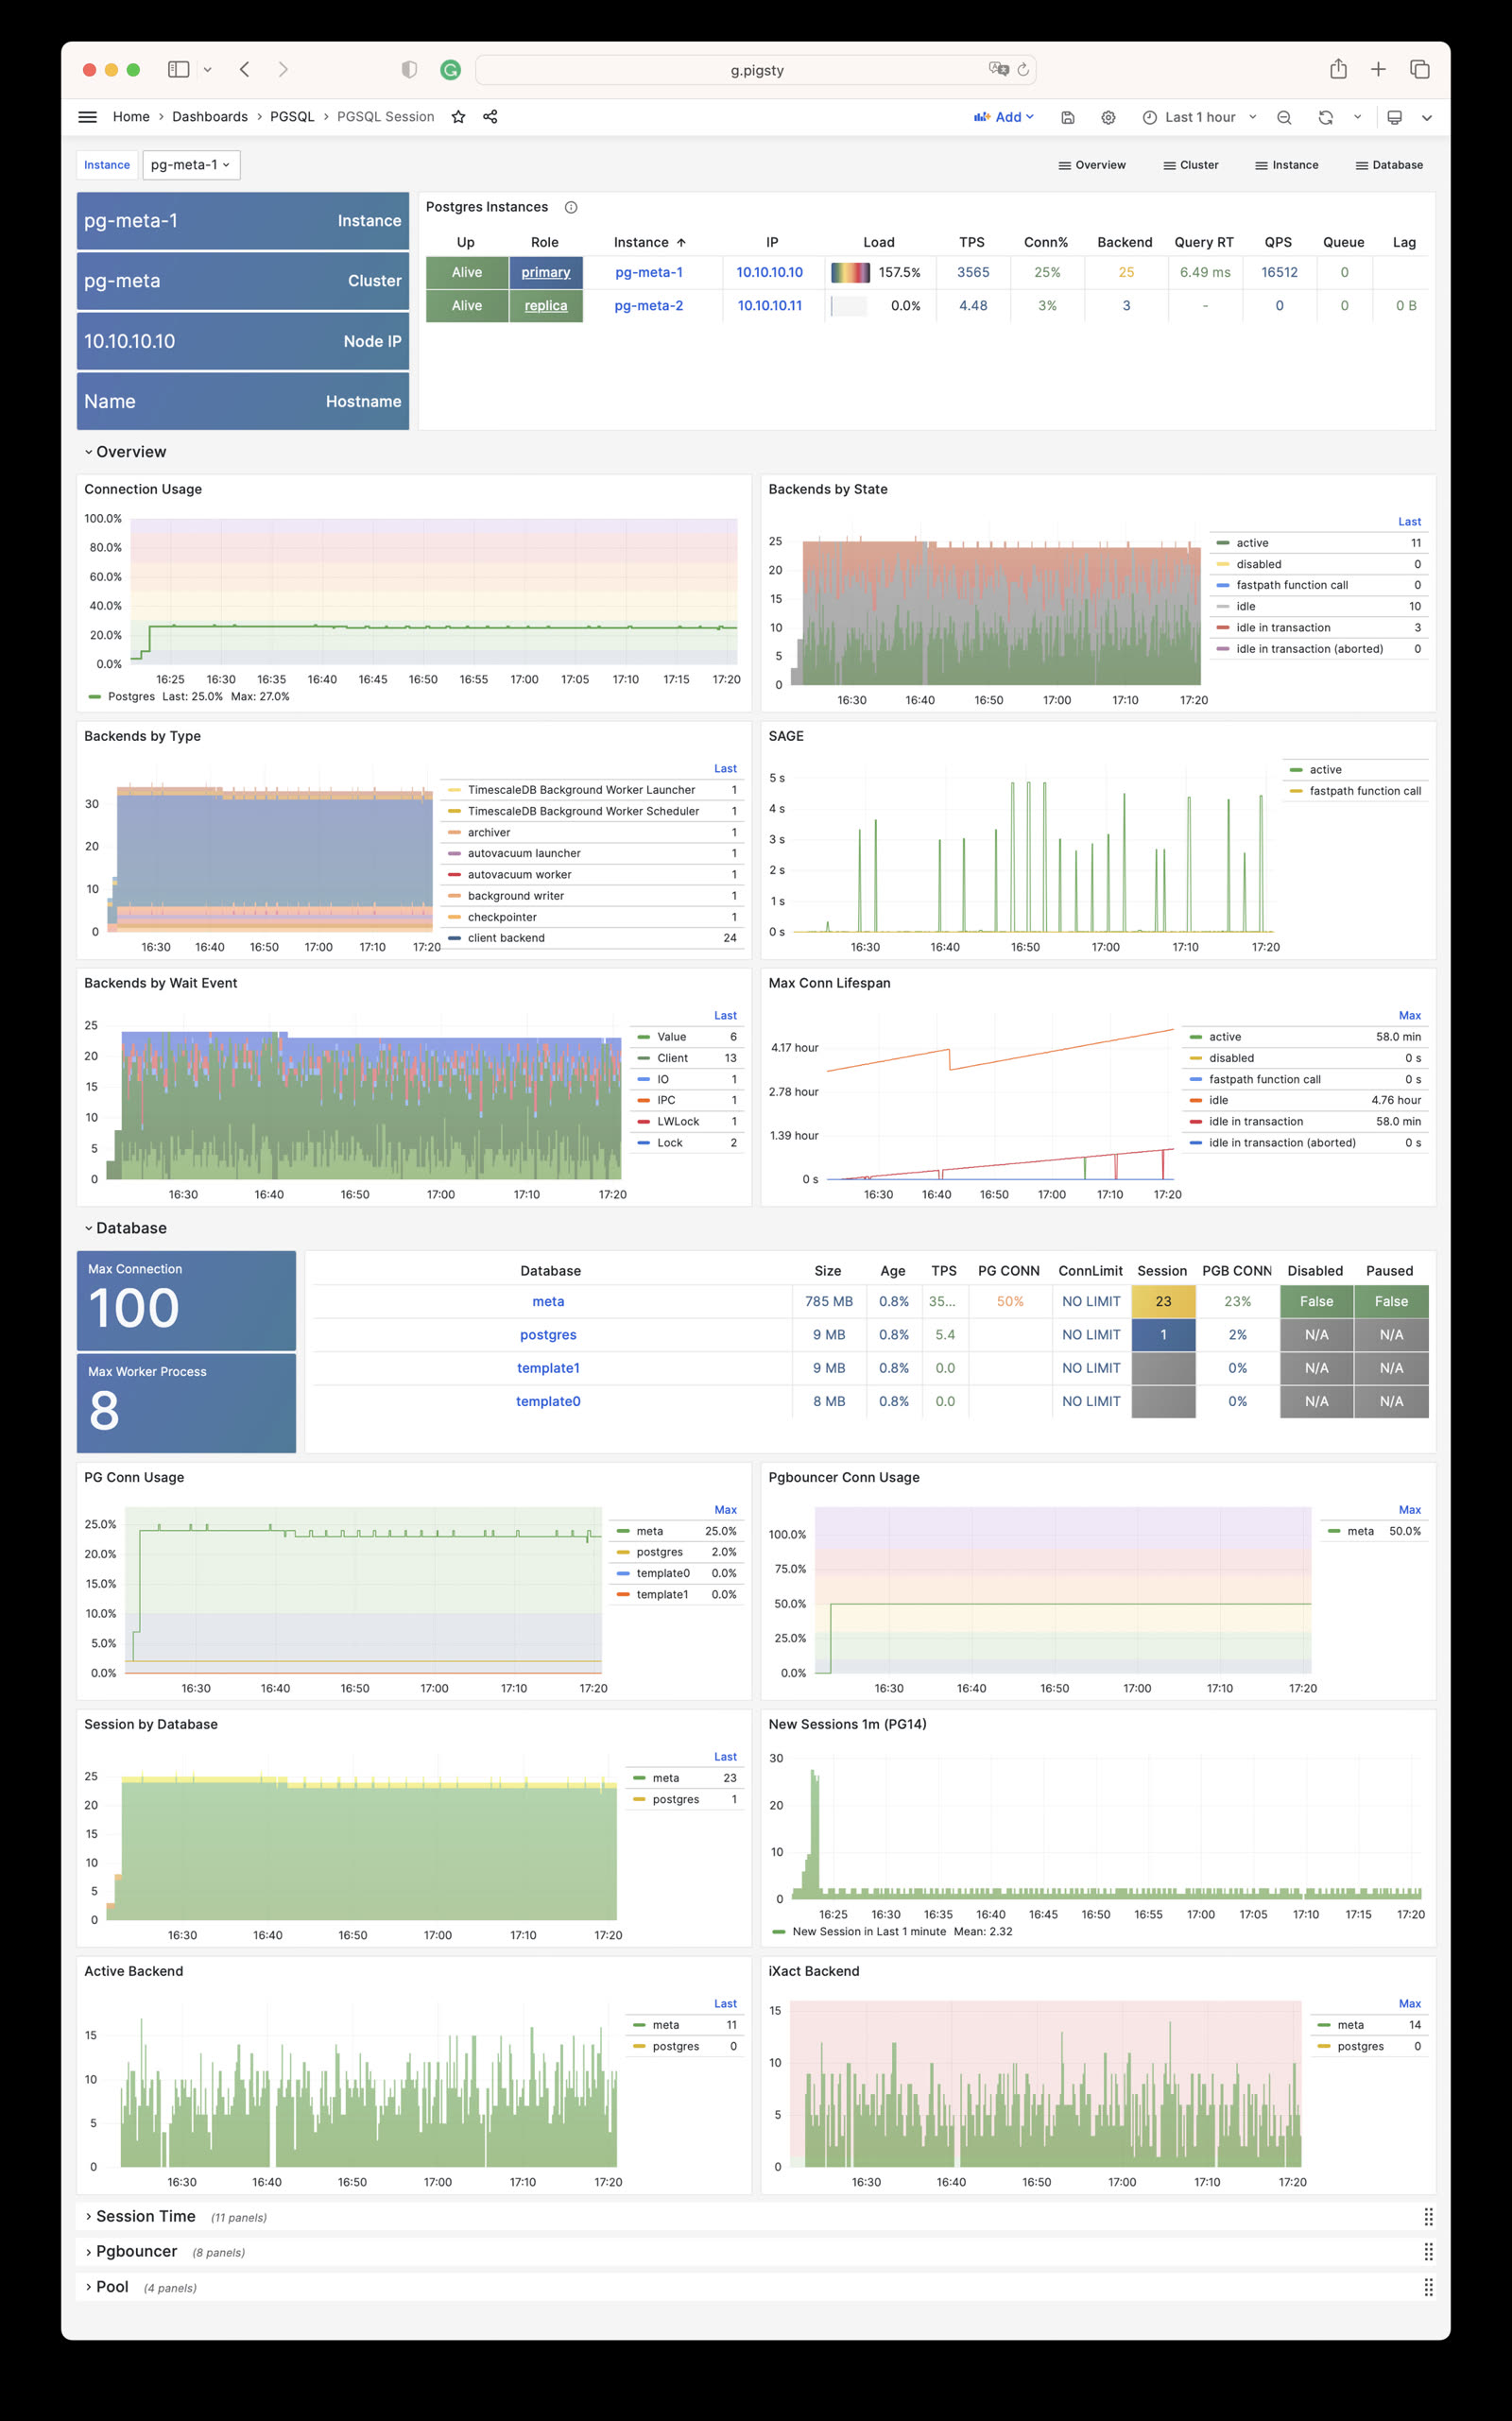
PGSQL Session: Session and active/idle time metrics for a single instance
PGSQL Exporter: Self-monitoring metrics for Postgres/Pgbouncer exporters
Database
PGSQL Database: Main dashboard for a single PGSQL database
PGSQL Tables: Table/index access metrics within a single database
PGSQL Table: Detailed info for a single table (QPS/RT/index/sequence…)
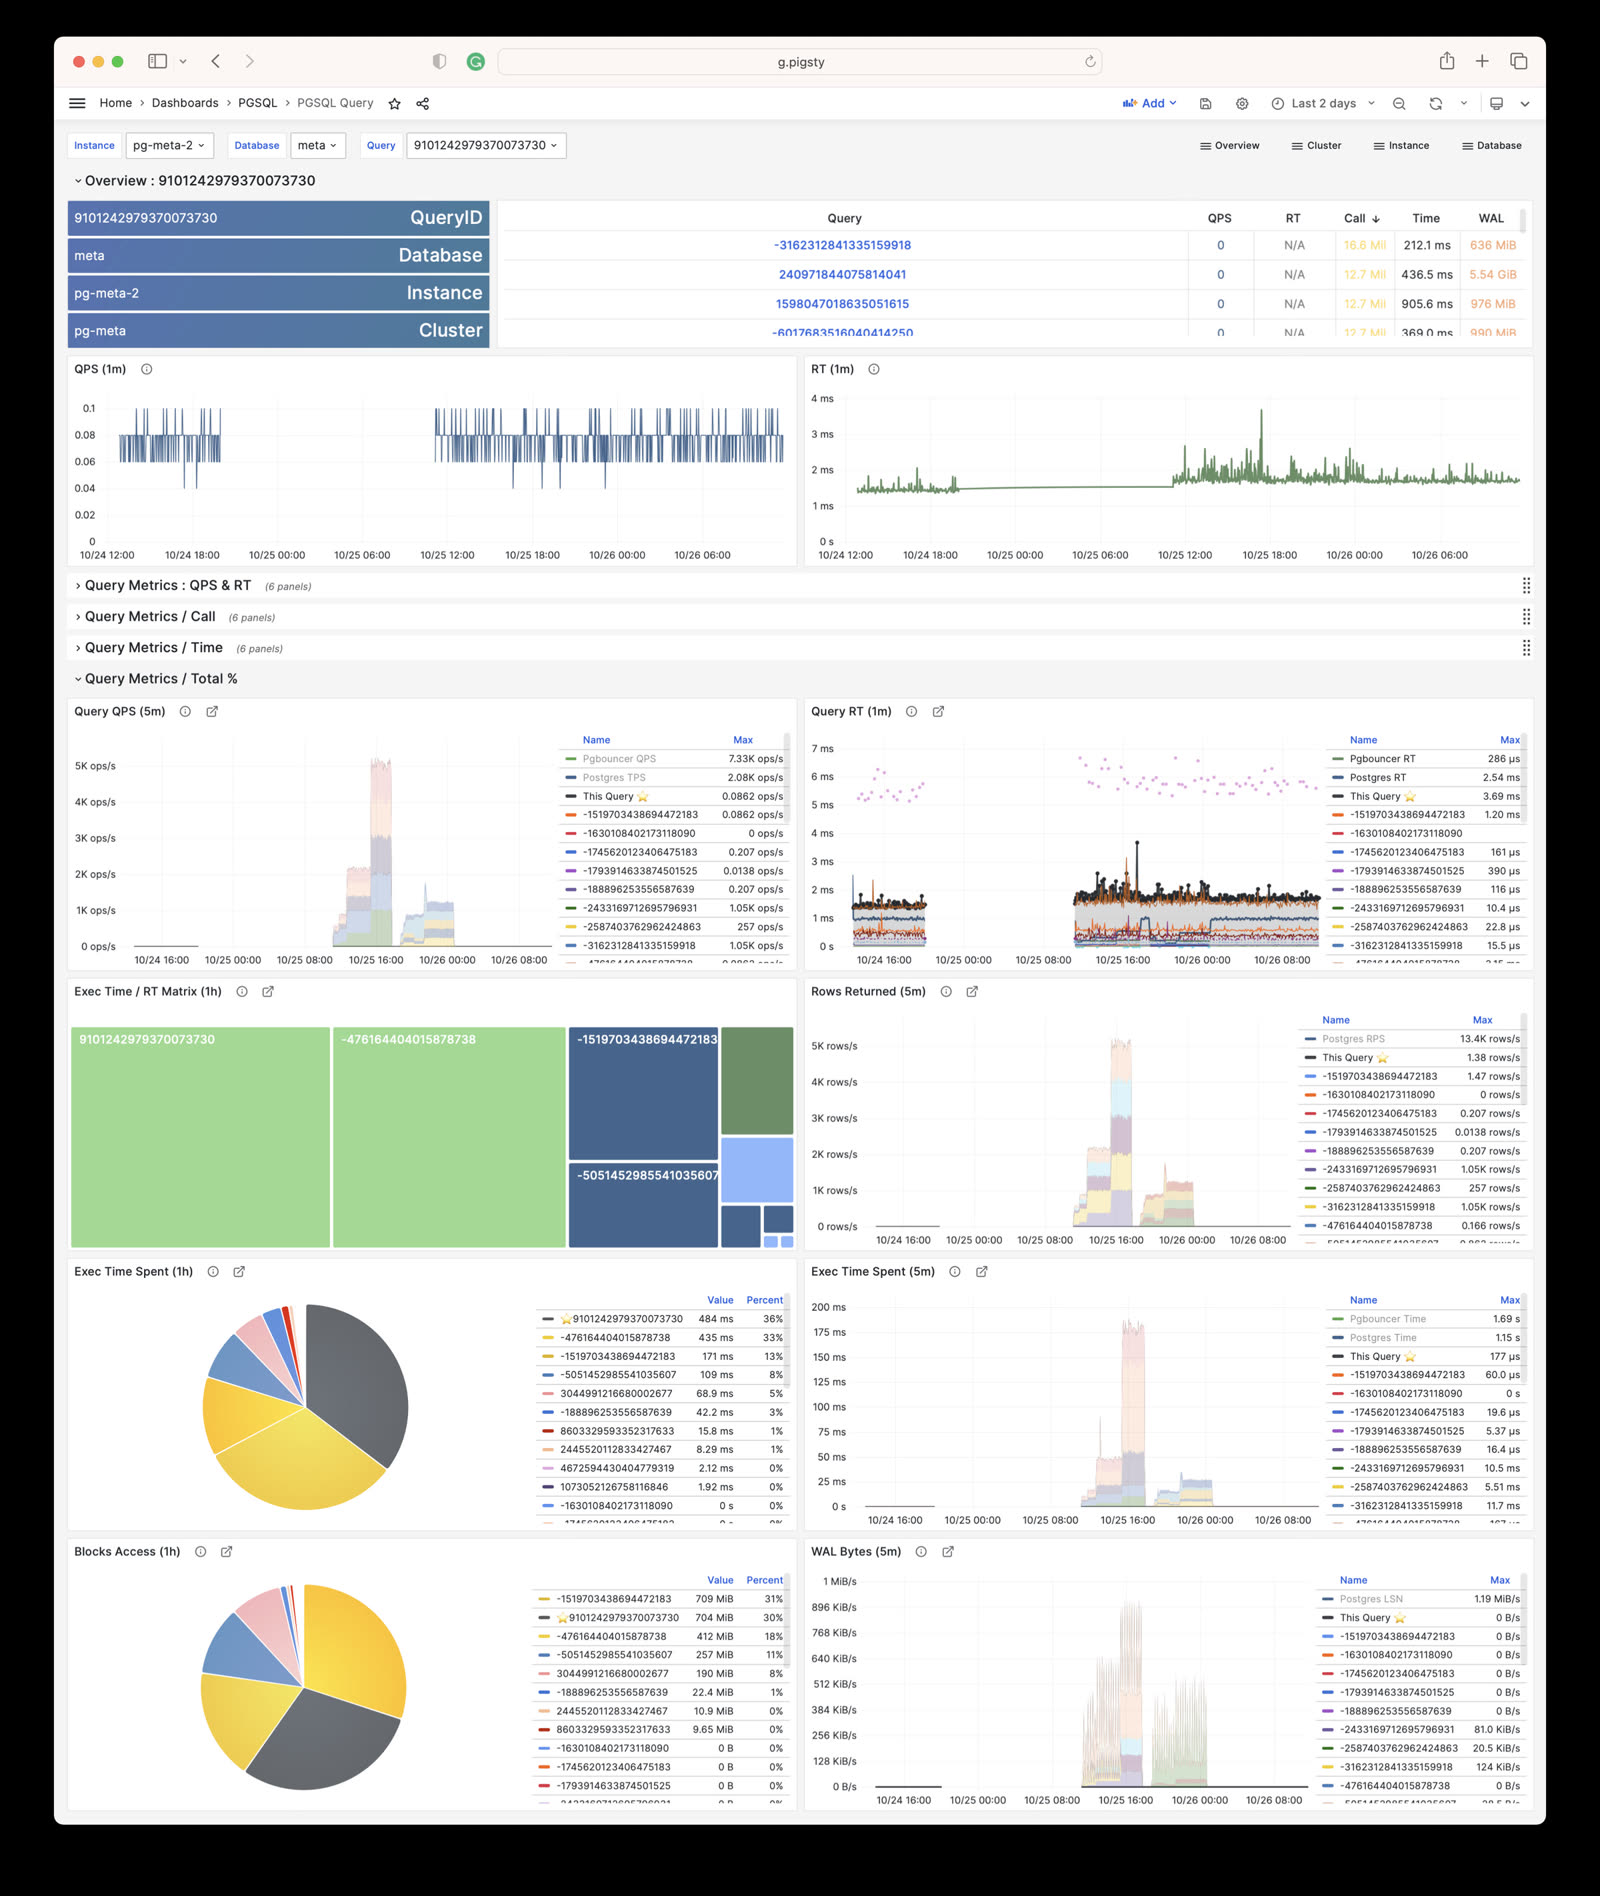
PGSQL Query: Detailed info for a query type (QPS/RT)
PGCAT
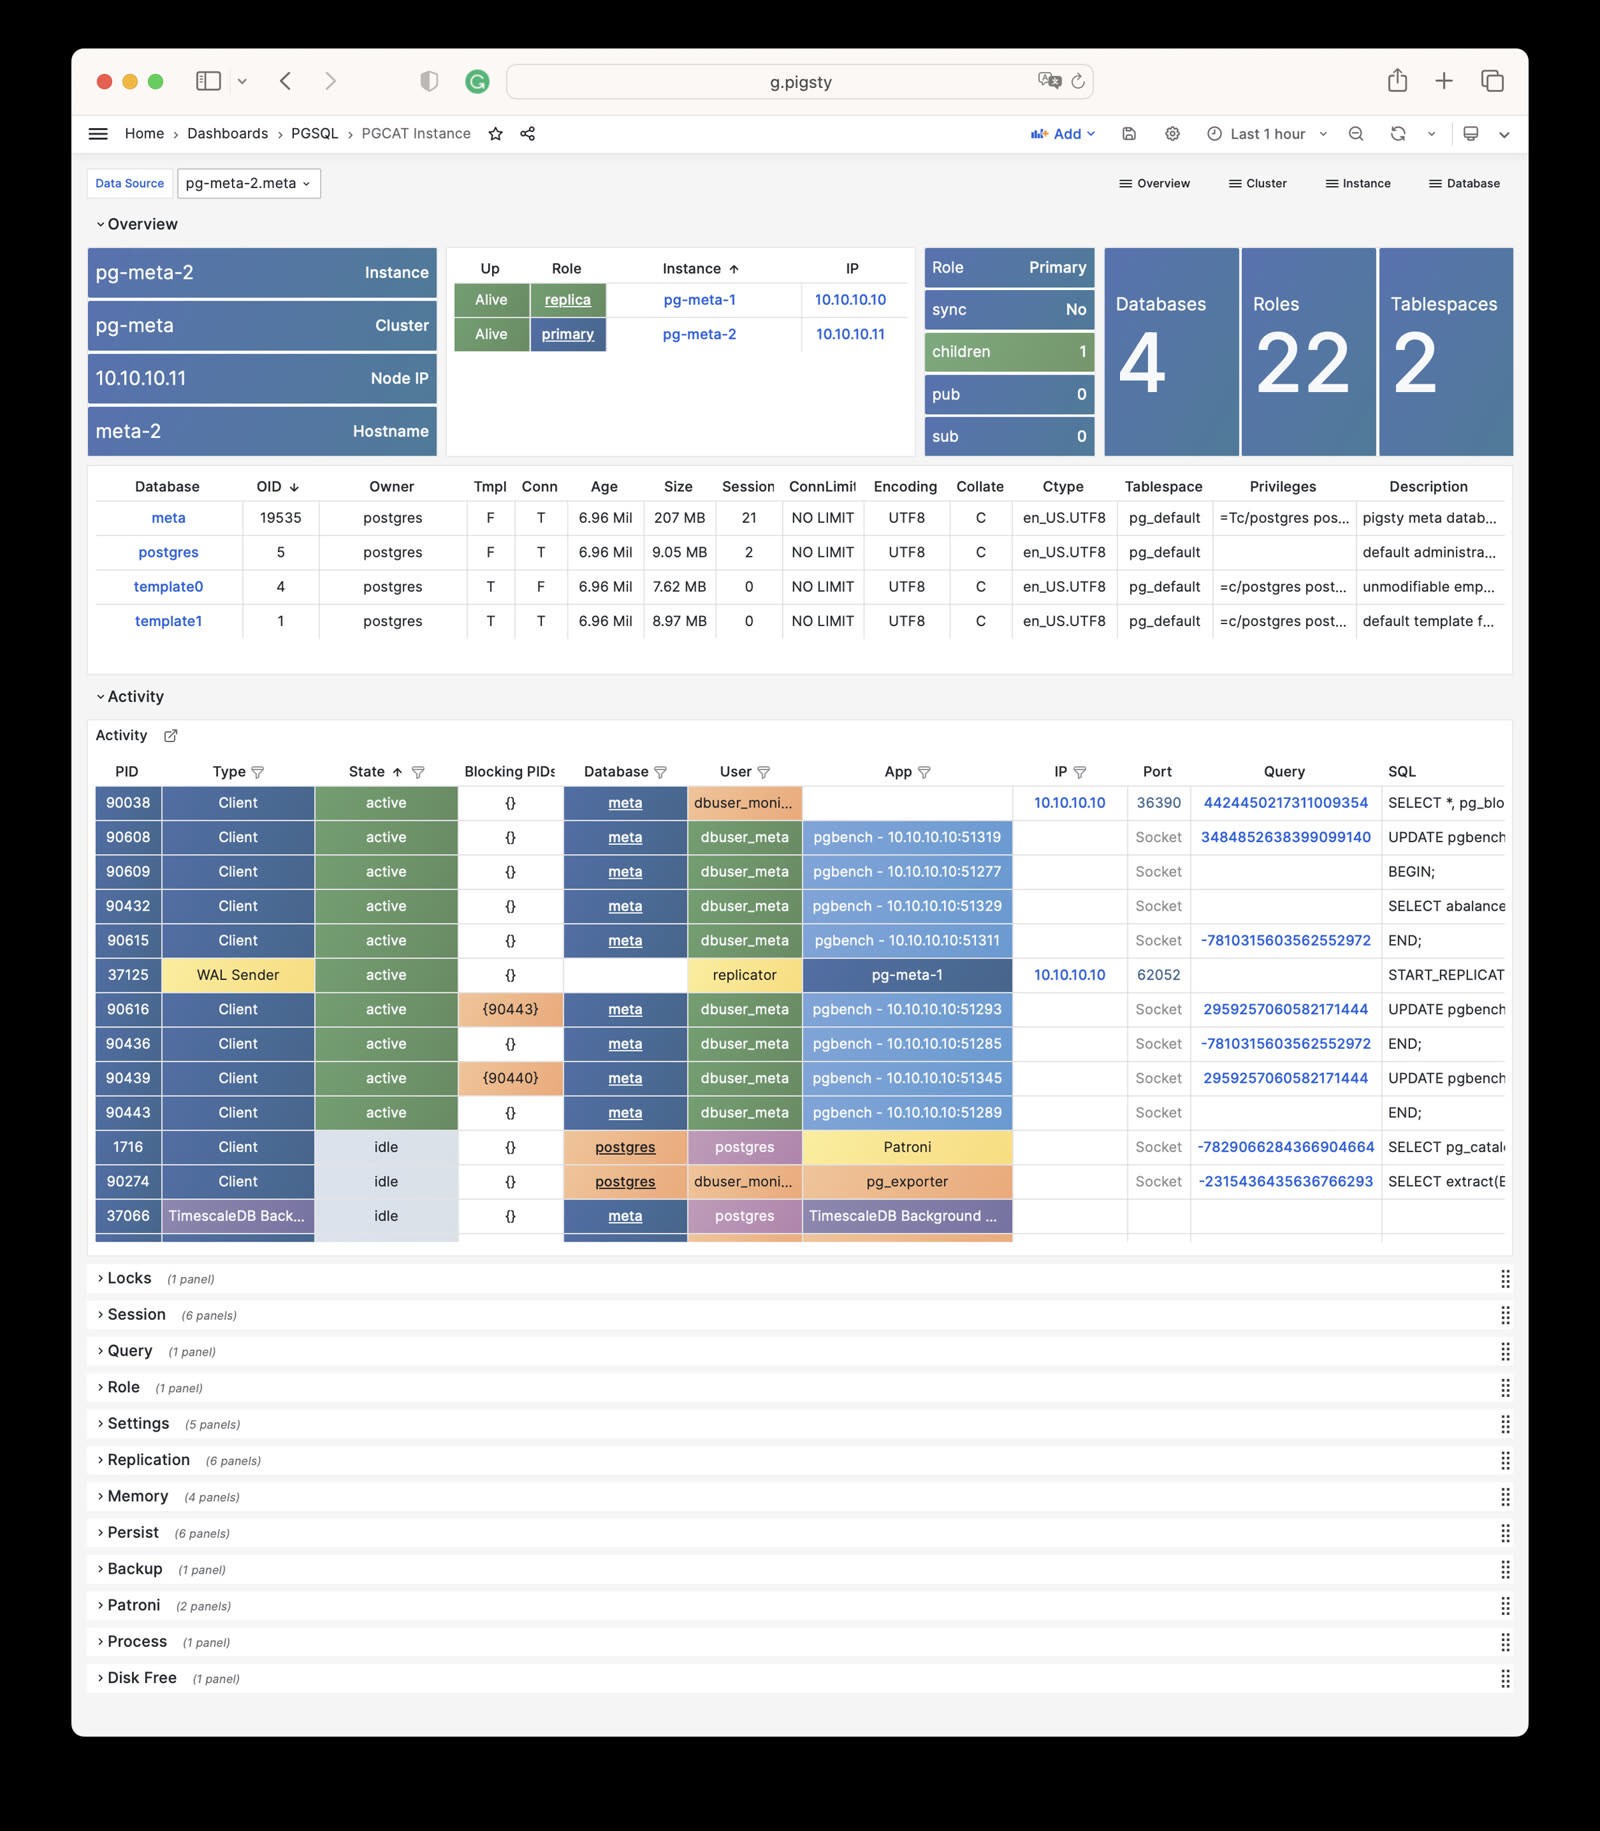
PGCAT Instance: Instance info retrieved directly from database catalog
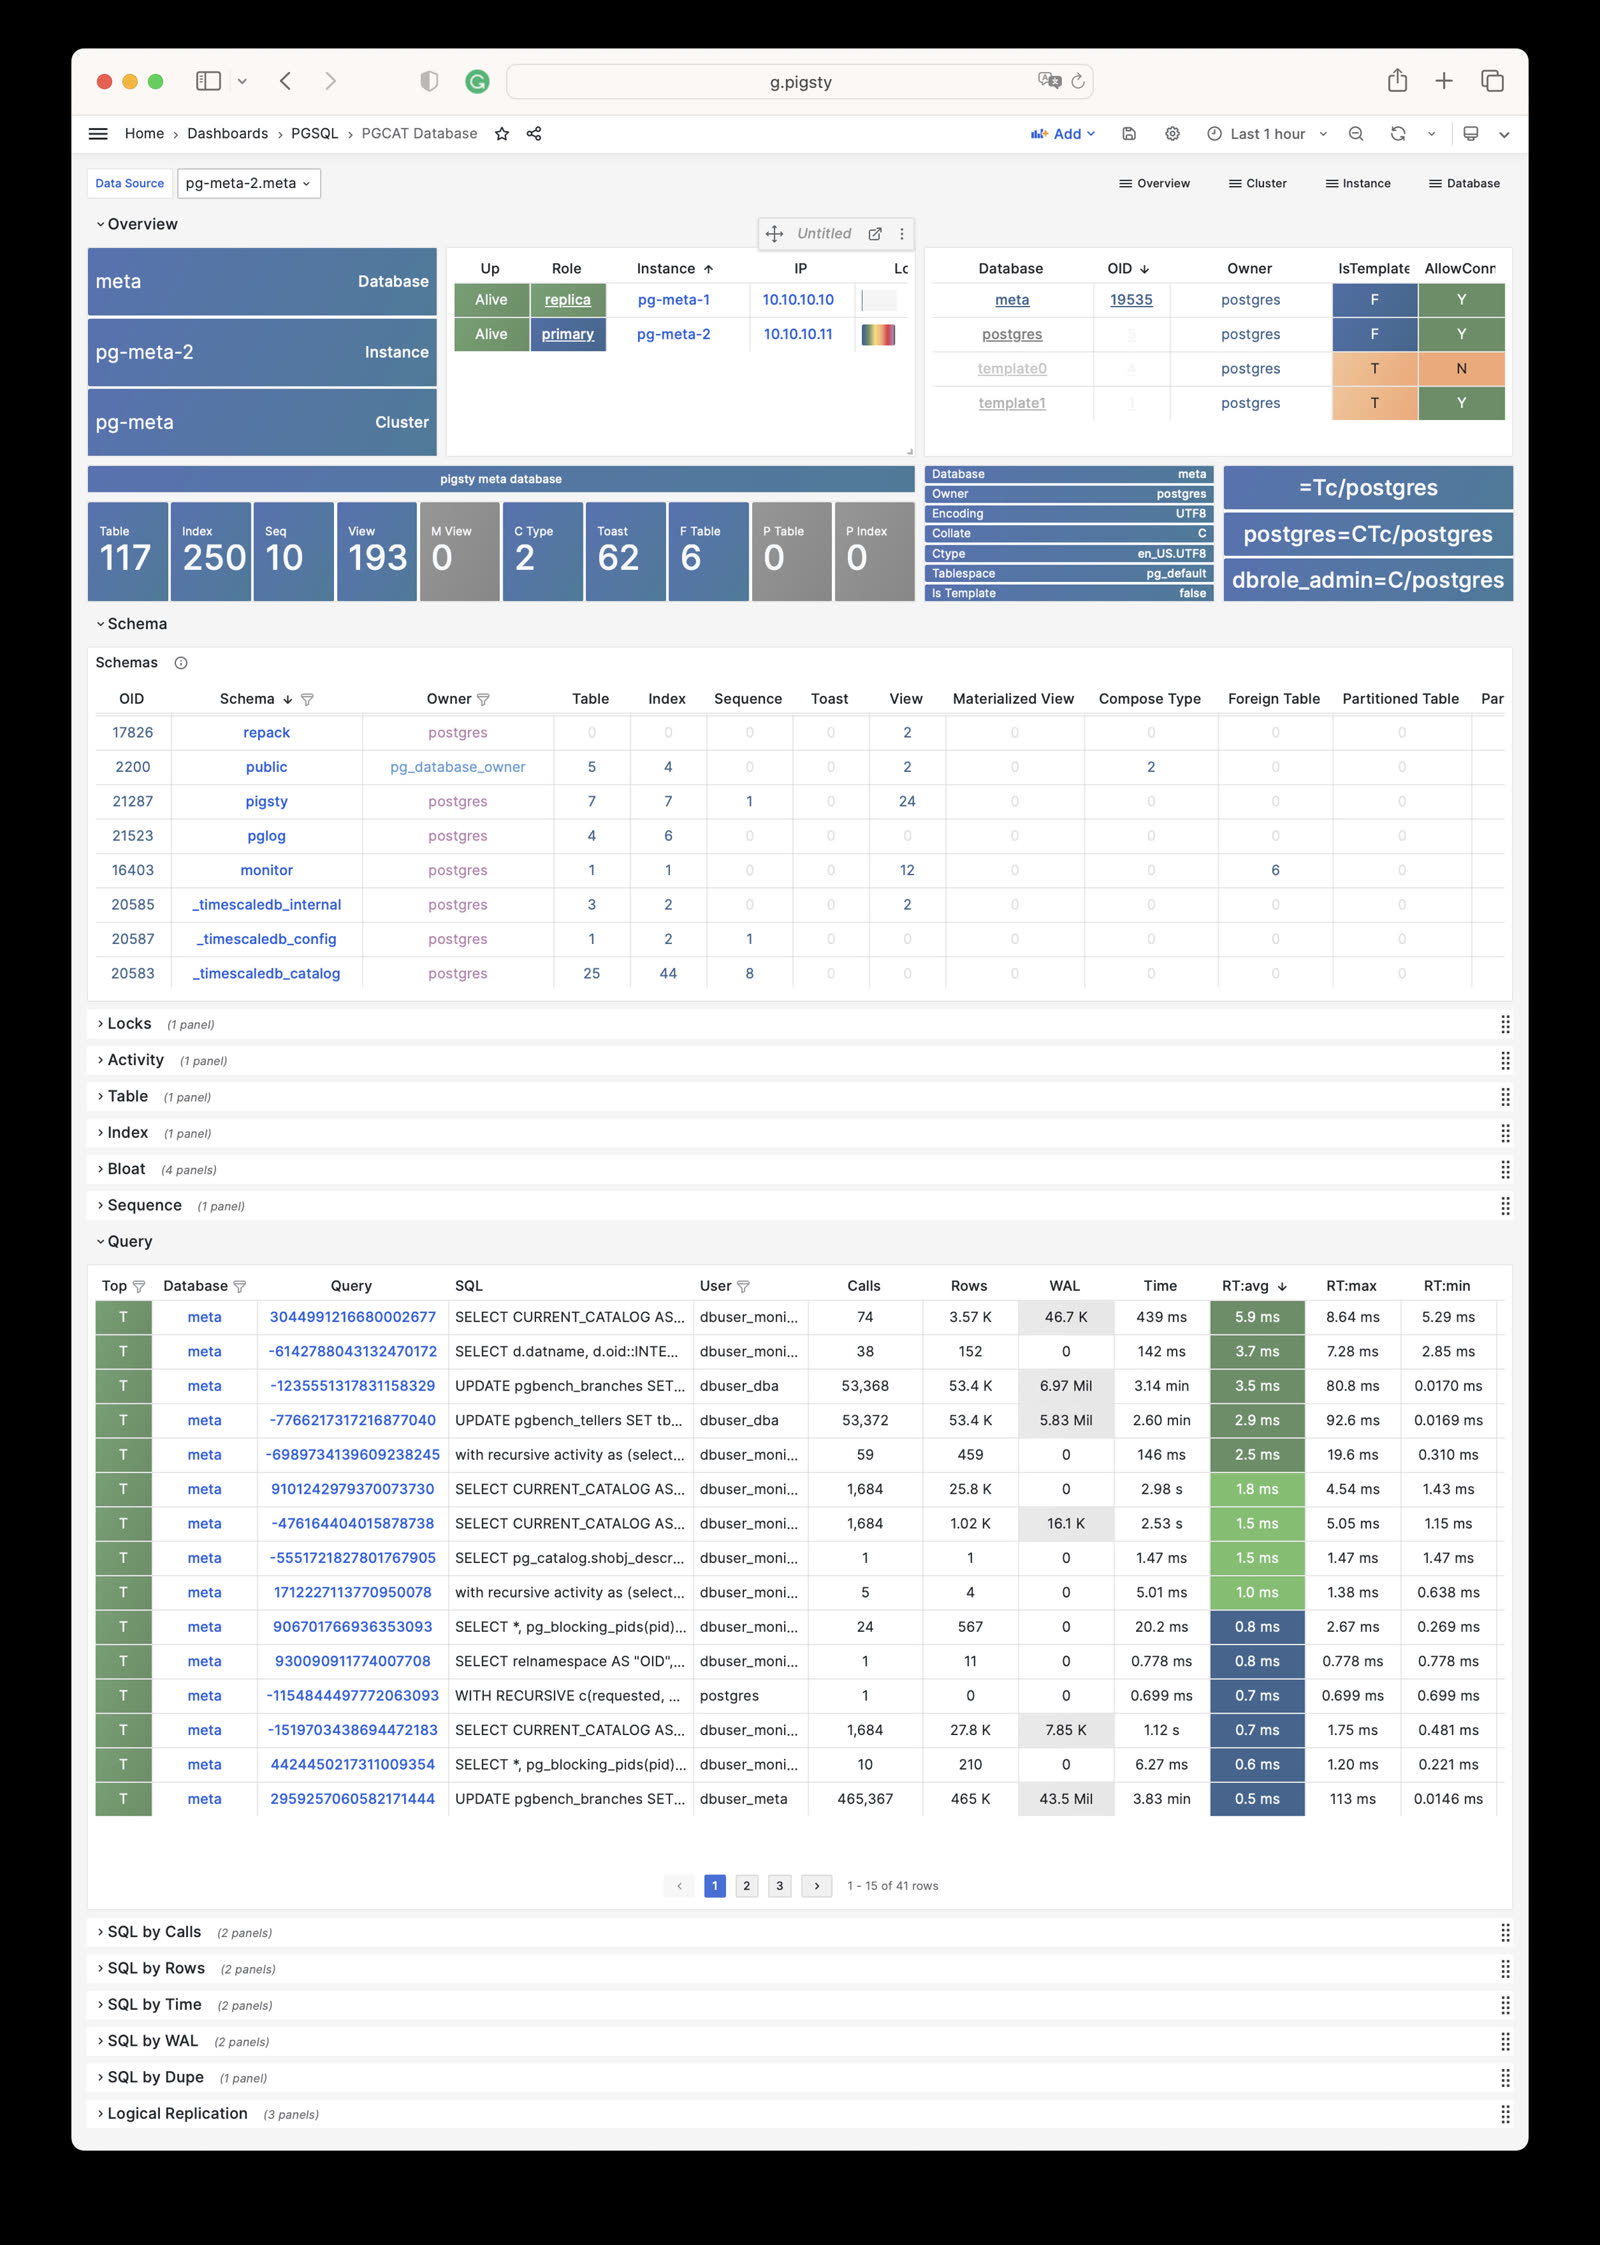
PGCAT Database: Database info retrieved directly from database catalog
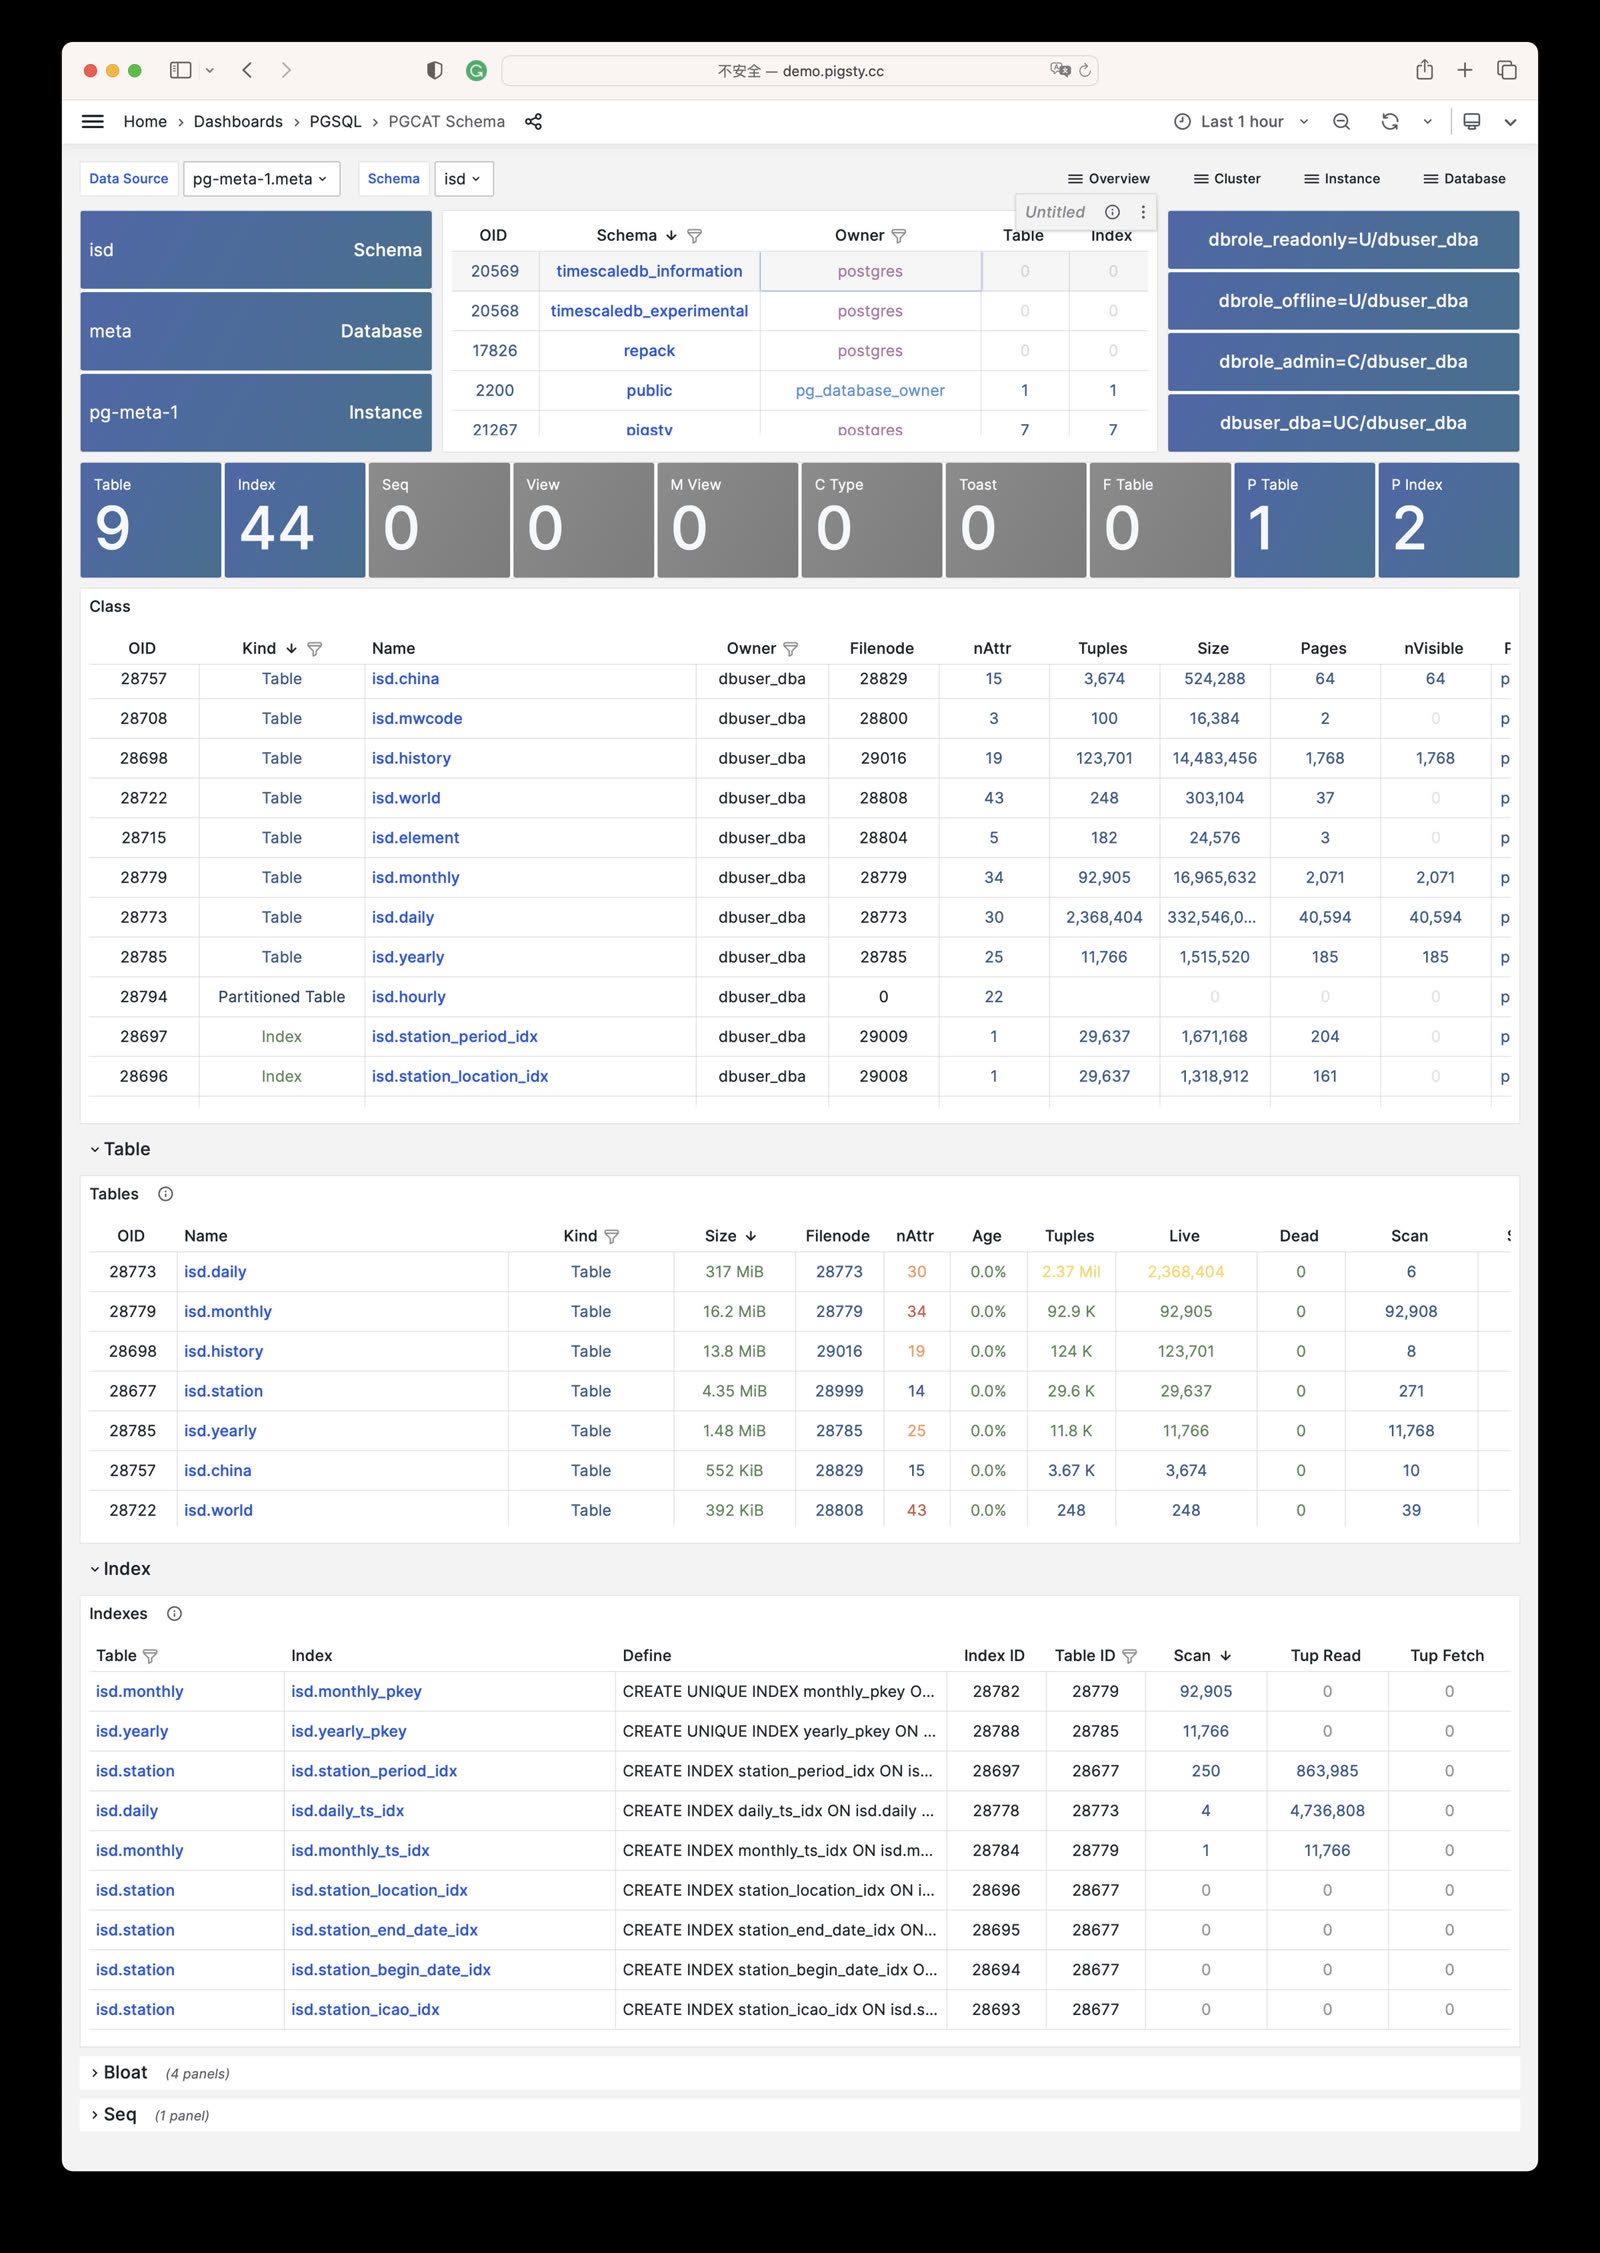
PGCAT Schema: Schema info from database catalog (tables/indexes/sequences…)
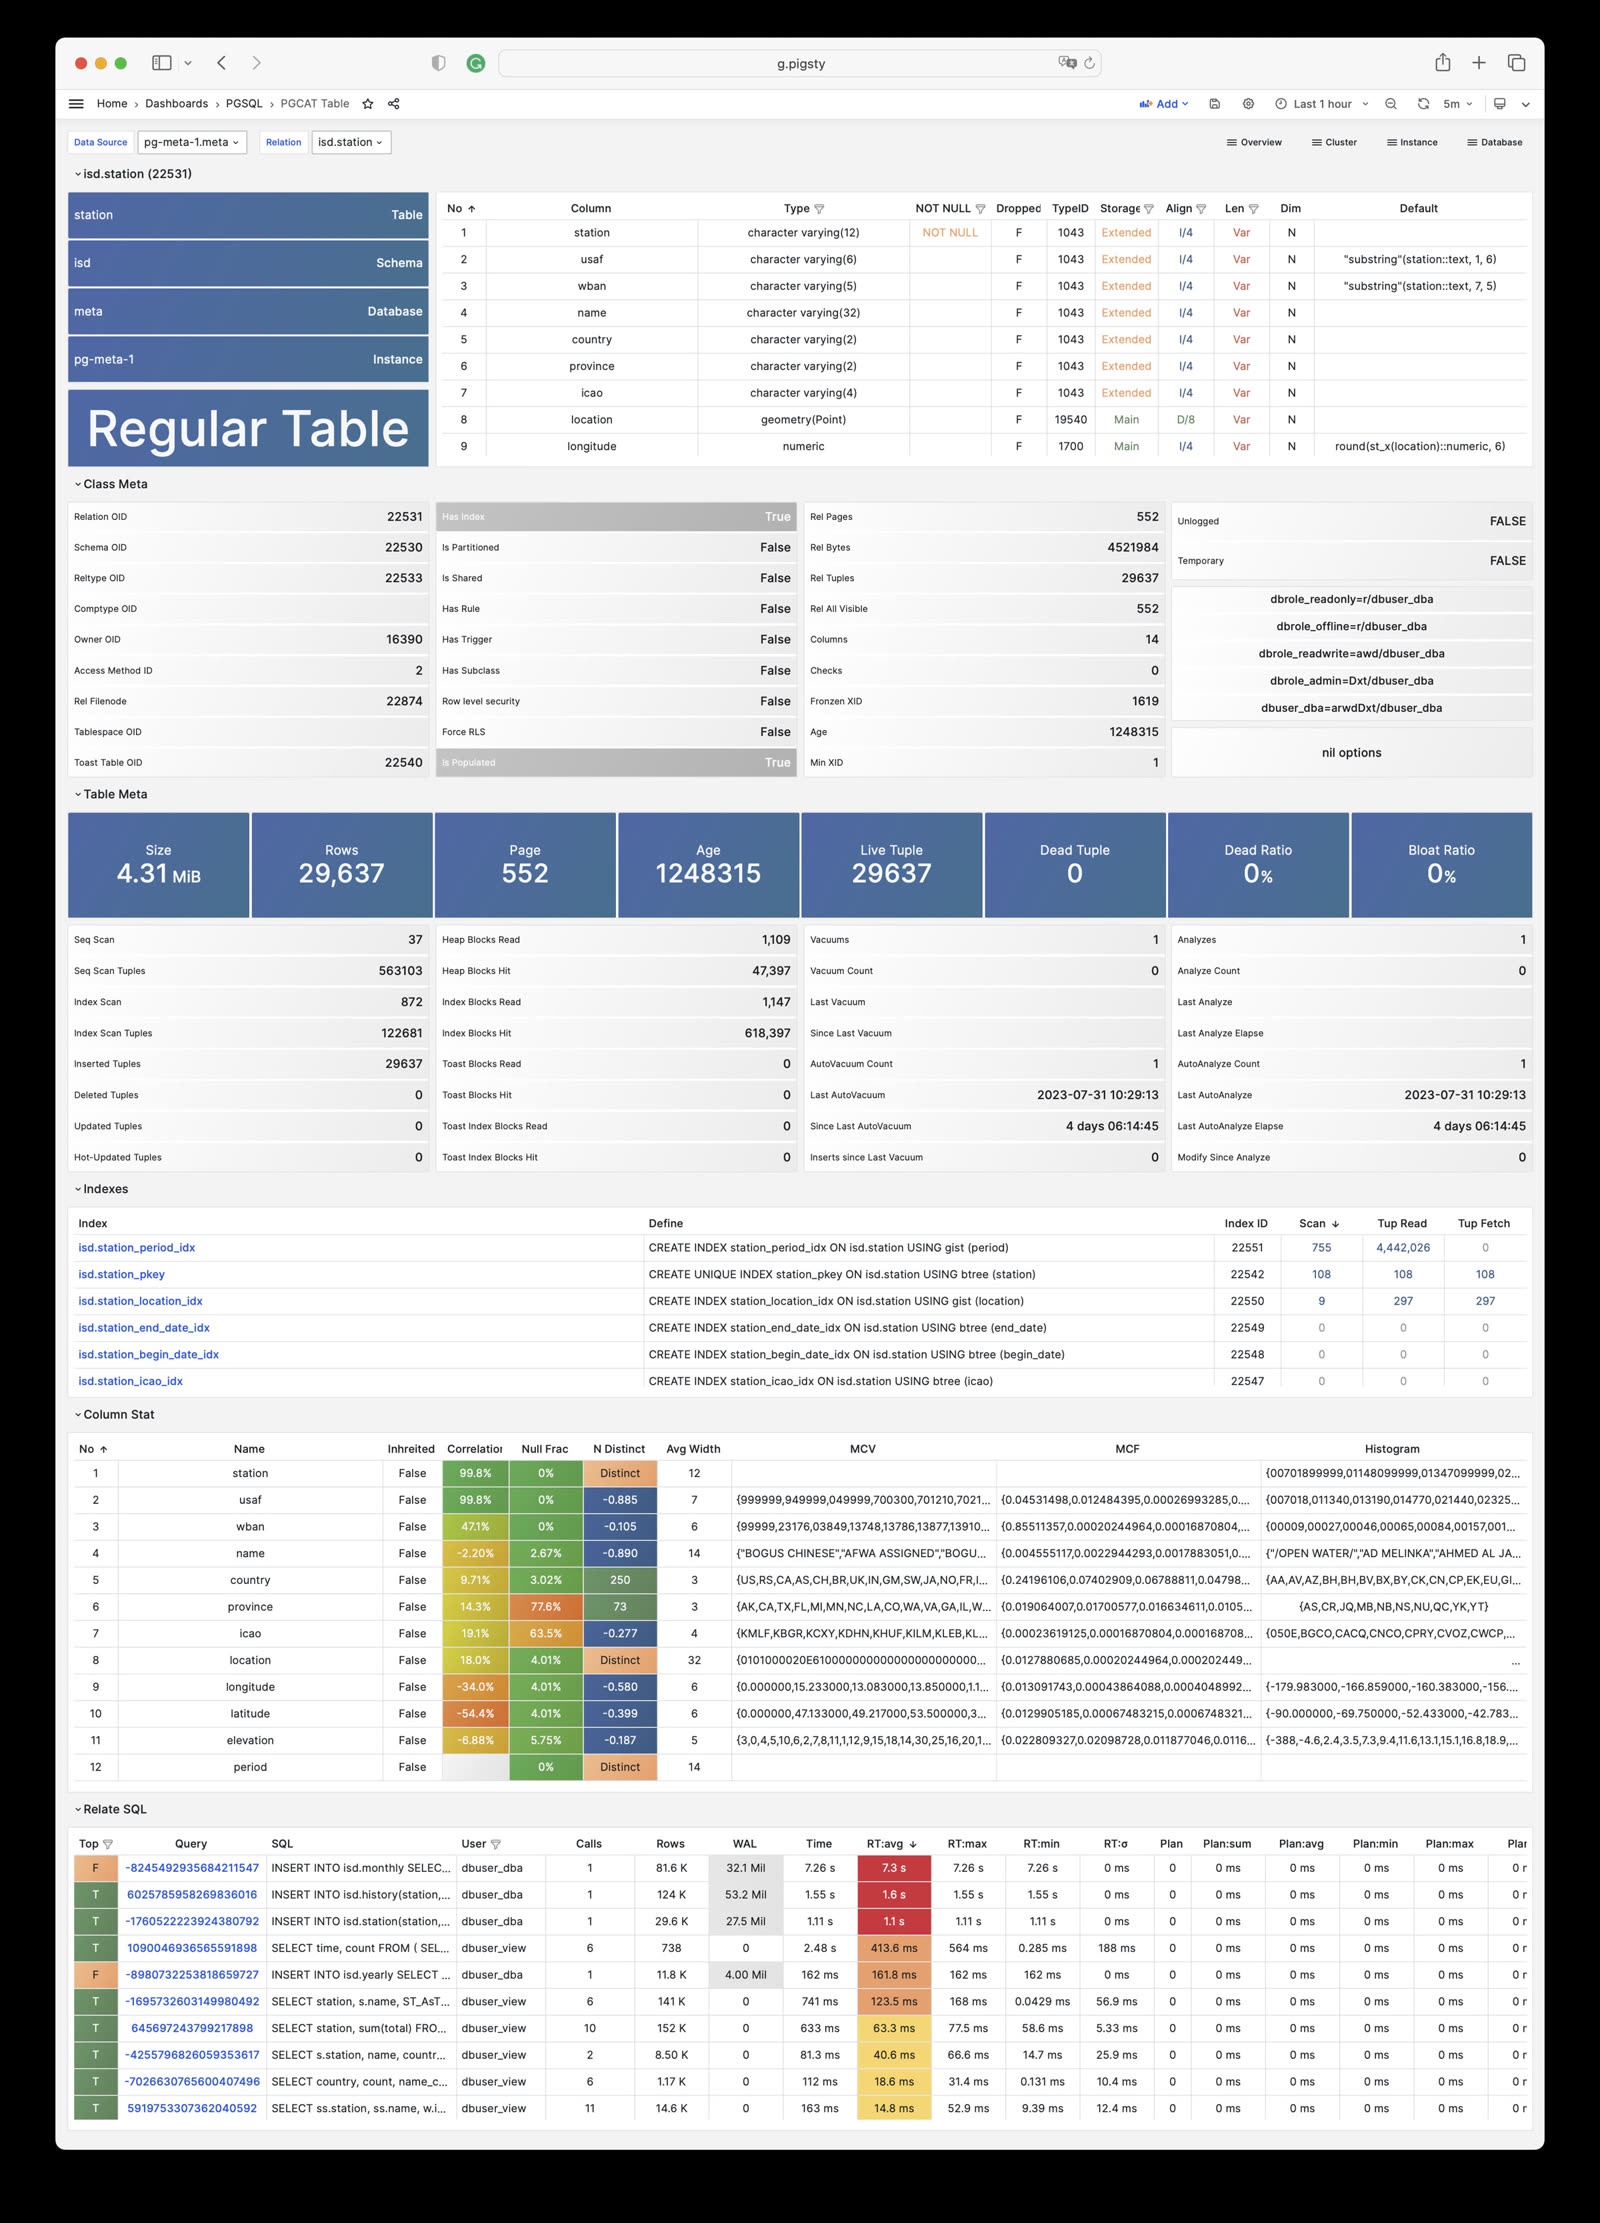
PGCAT Table: Detailed table info from database catalog (stats/bloat…)
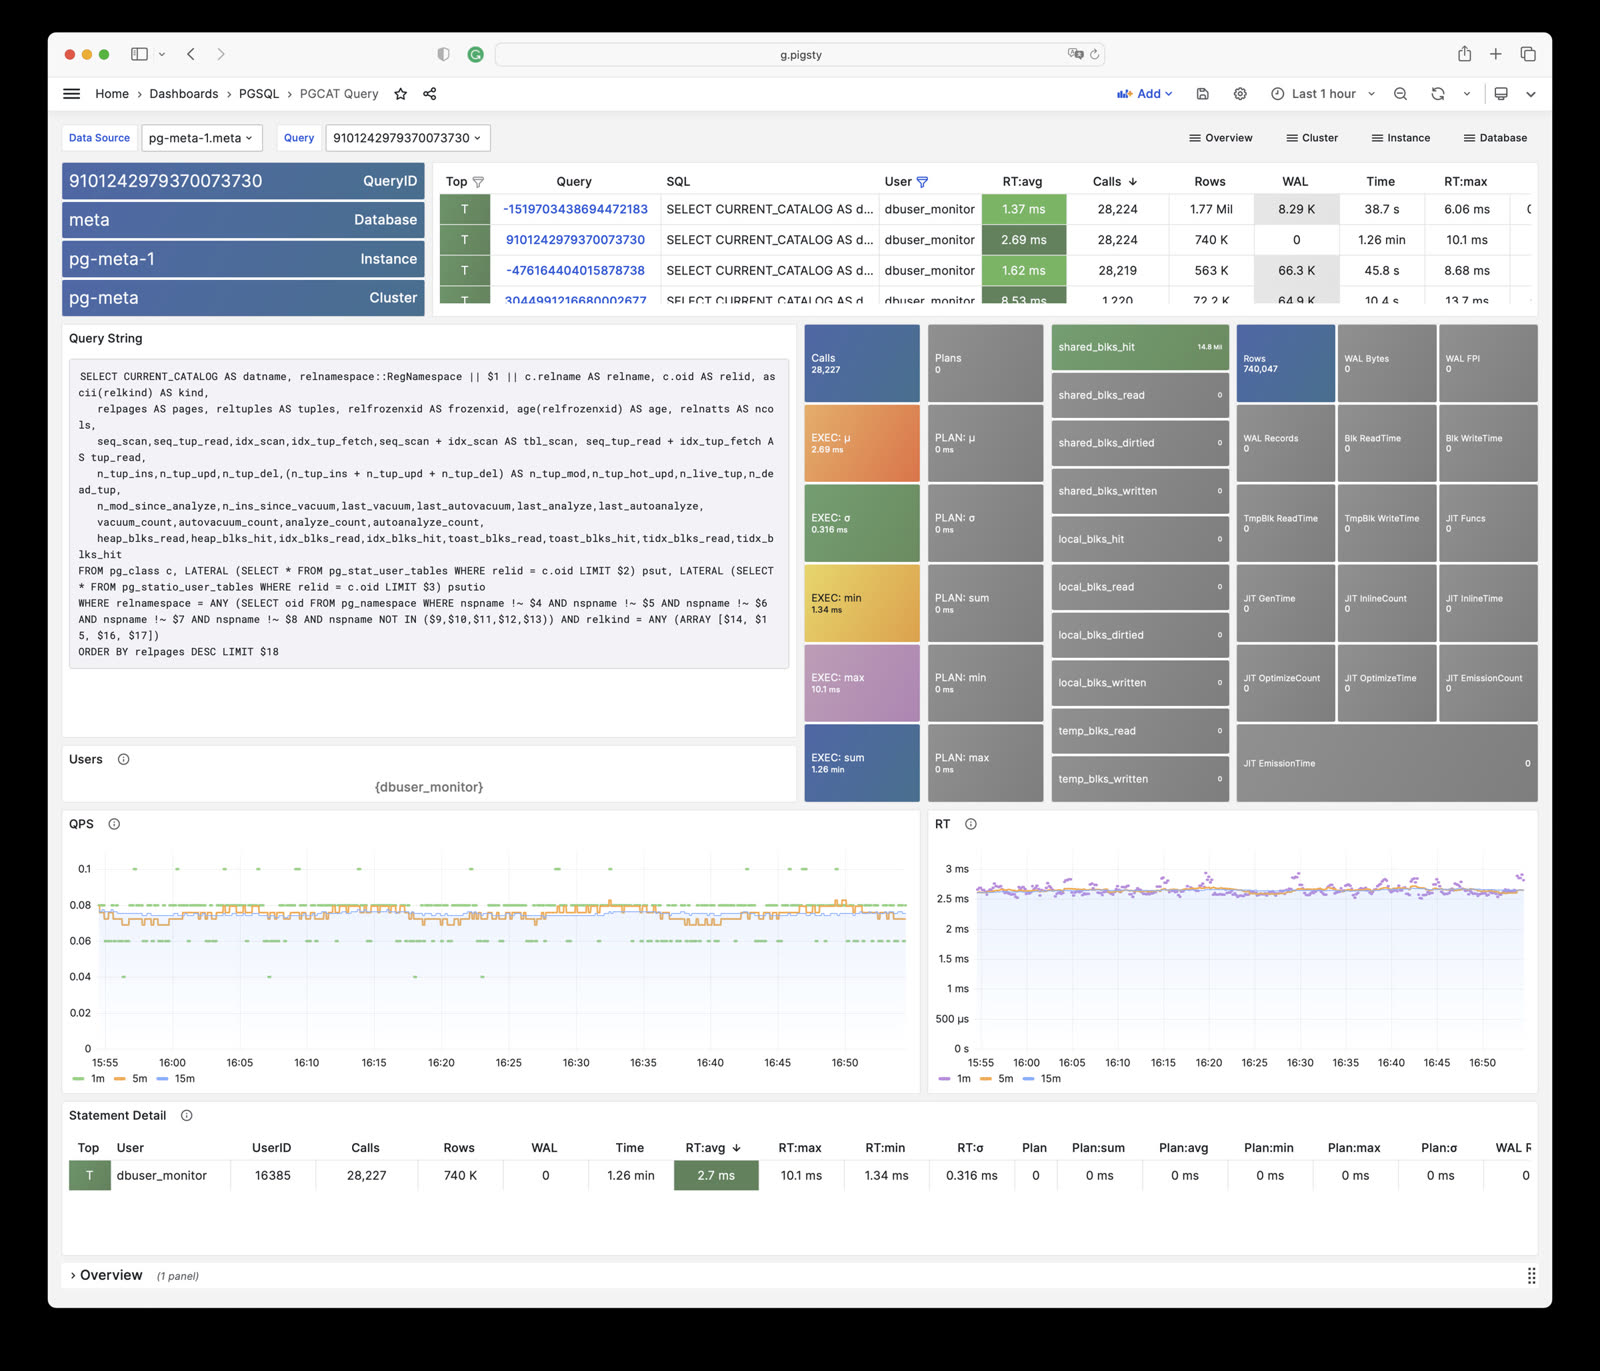
PGCAT Query: Query details from database catalog (SQL/stats)
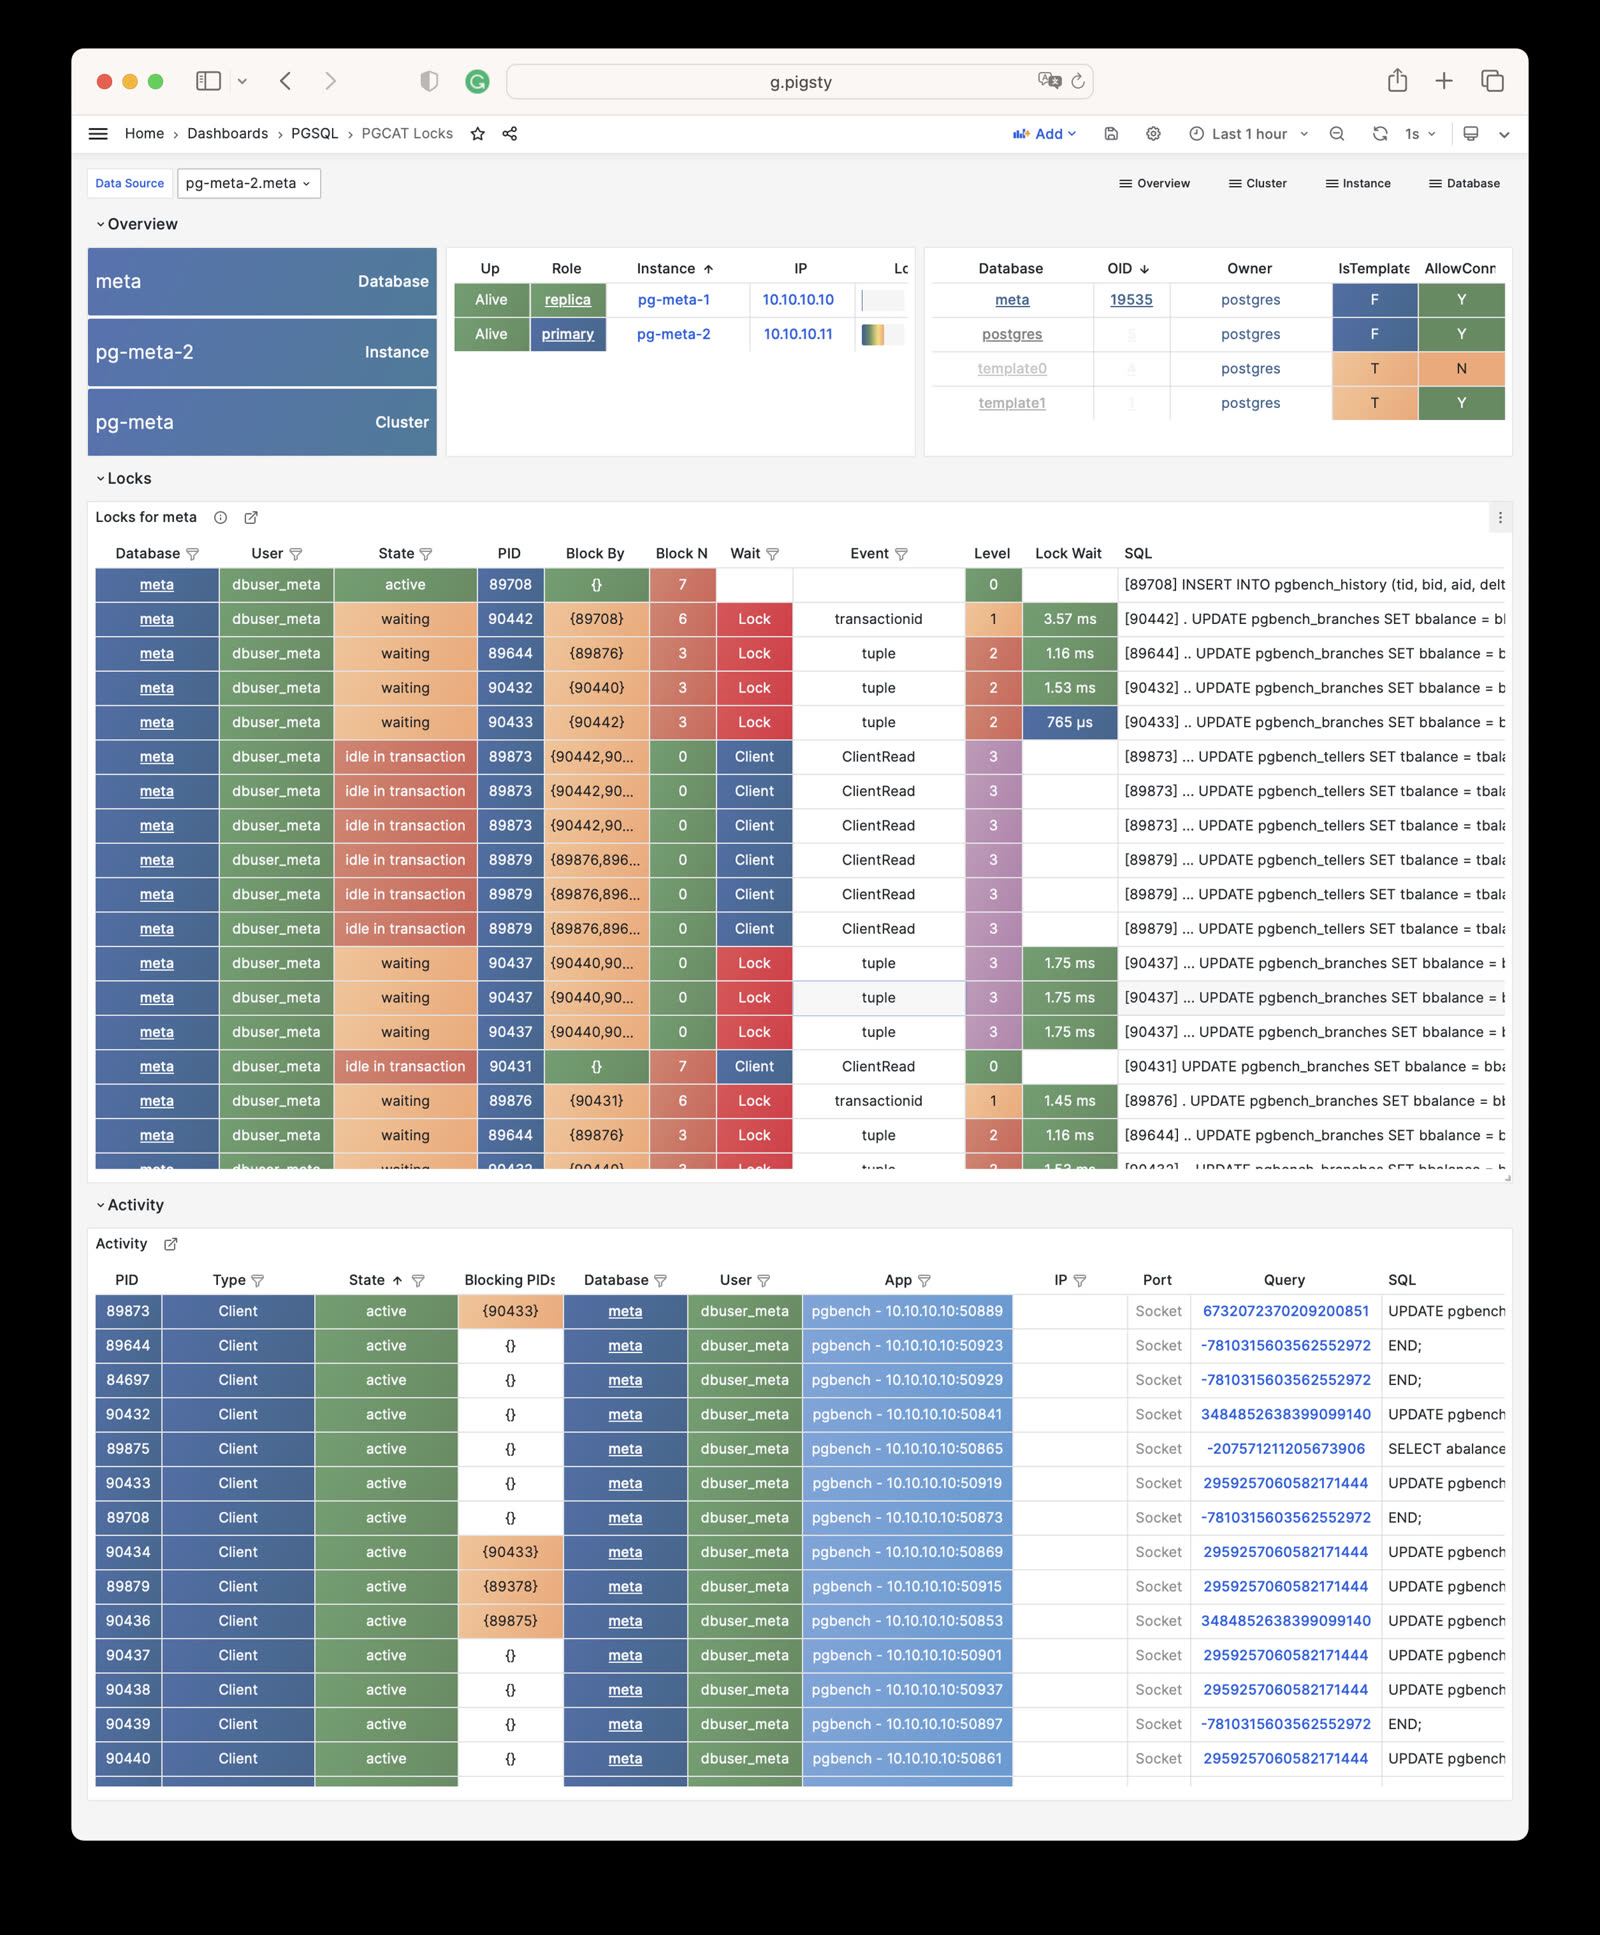
PGCAT Locks: Activity and lock wait info from database catalog
PGLOG
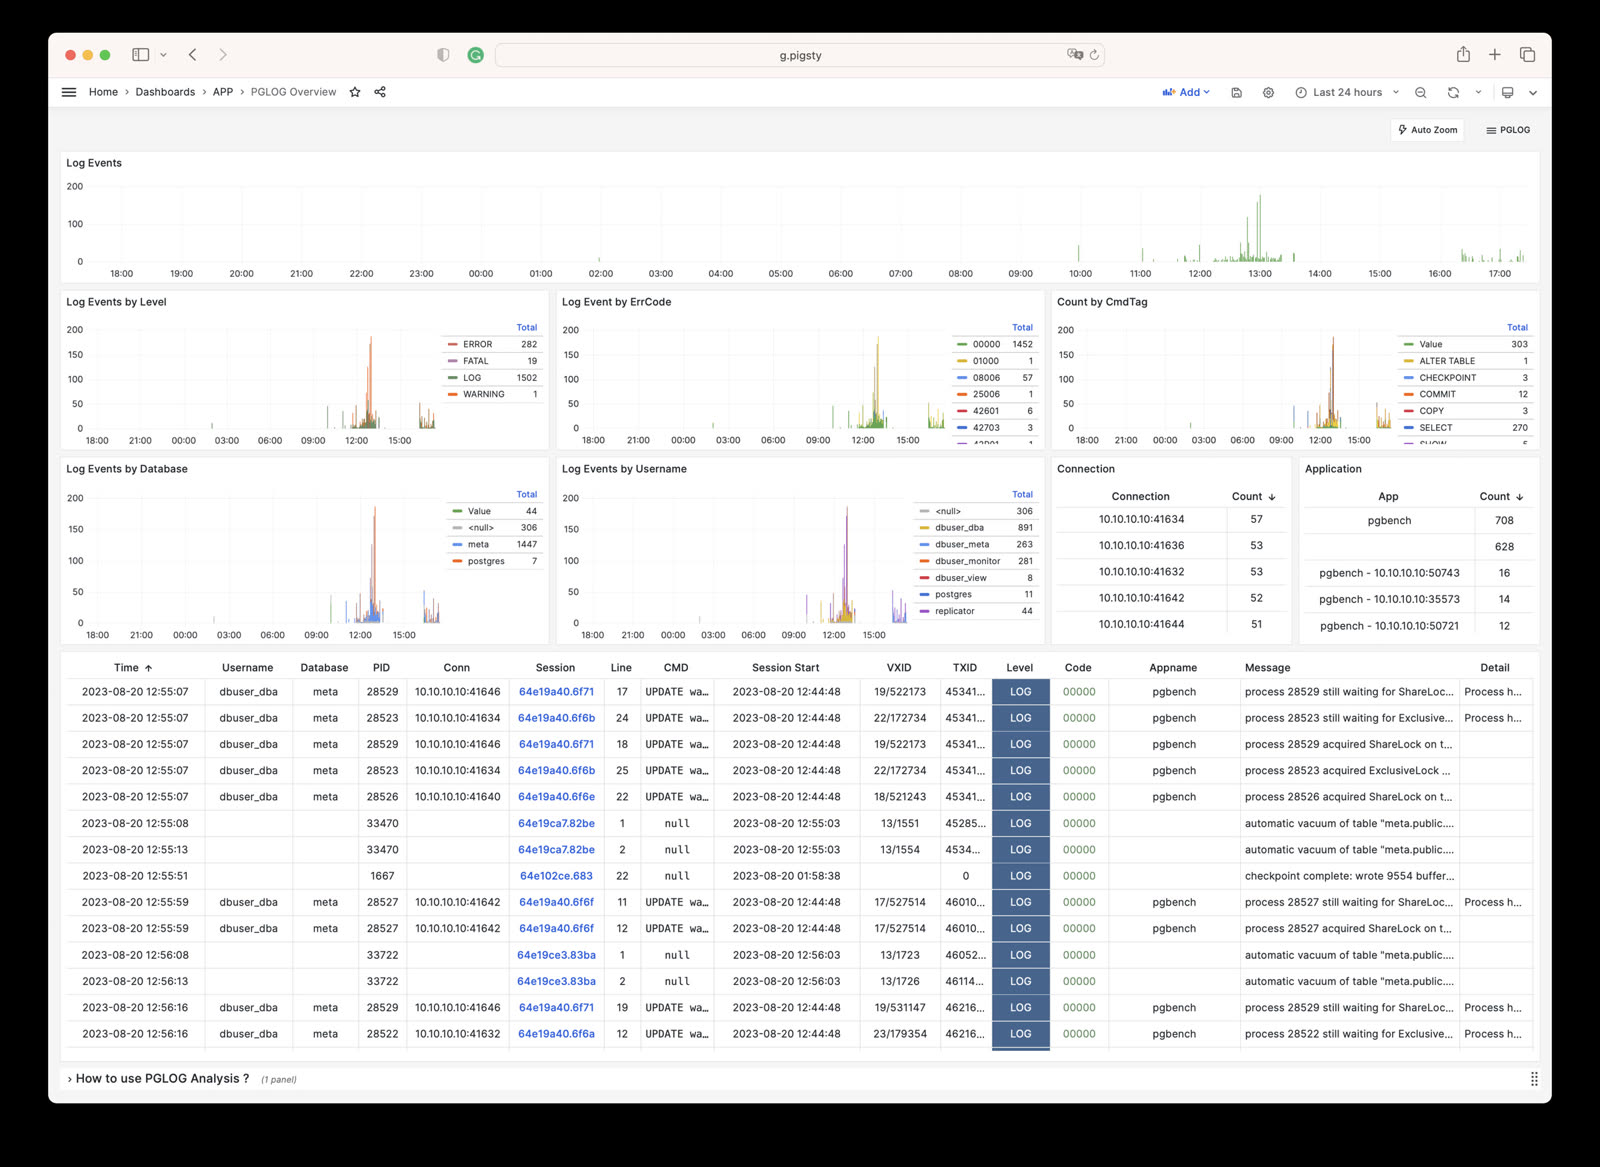
PGLOG Overview: Overview of CSV log samples in Pigsty CMDB
PGLOG Session: Log details for a single session in CSV log samples
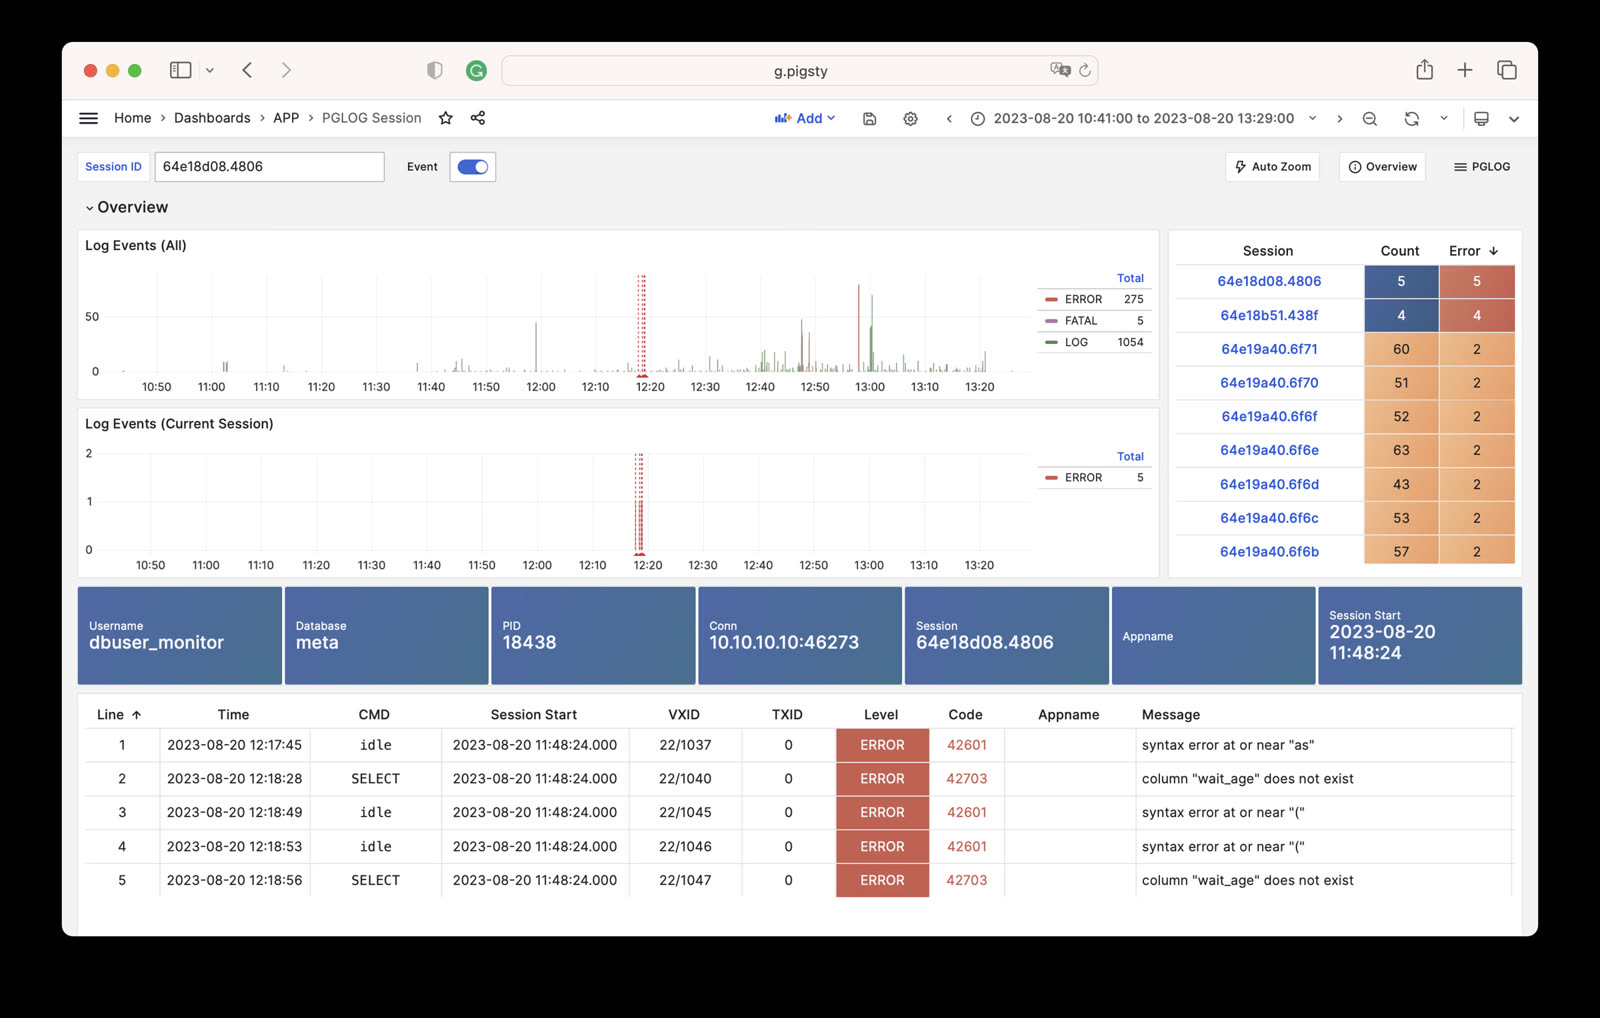
Gallery
See pigsty/wiki/gallery for details.
1 - Overview
PostgreSQL module global overview monitoring dashboards, including:
- PGSQL Overview: Main dashboard for the PGSQL module
- PGSQL Alert: Global key metrics and alert events for PGSQL
- PGSQL Shard: Overview of horizontally sharded PGSQL clusters
1.1 - PGSQL Overview
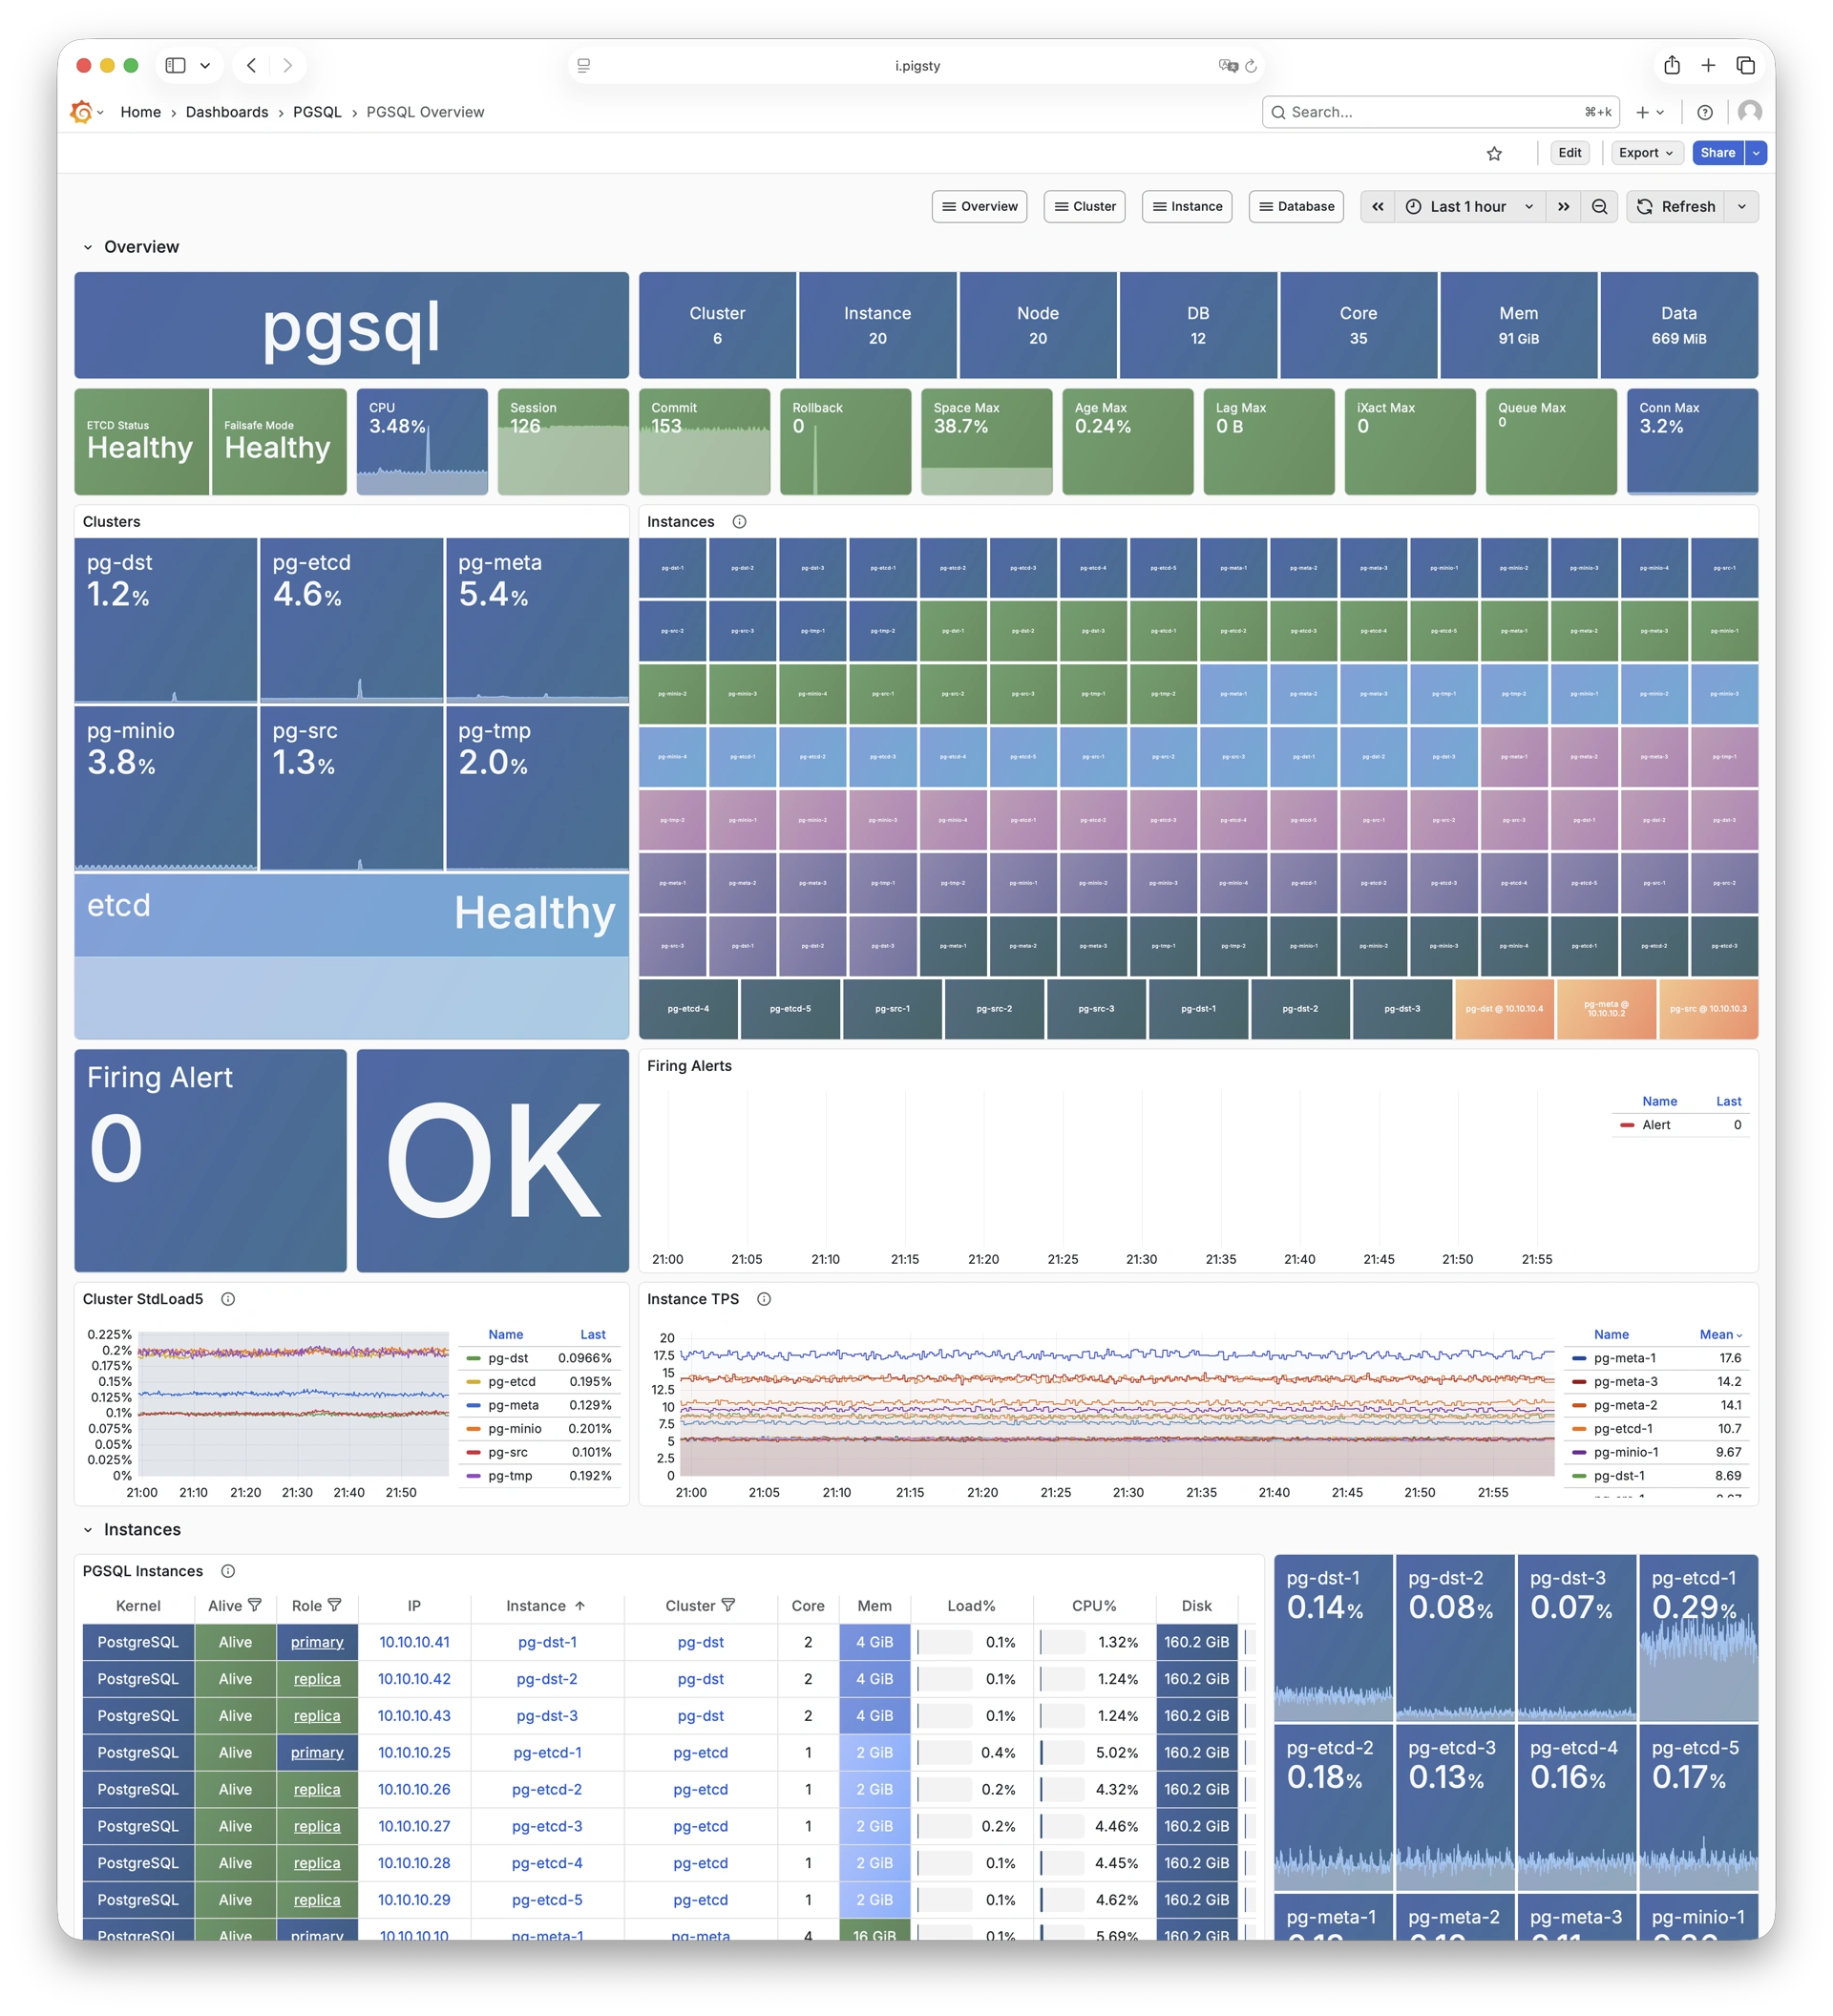
Main dashboard for the PGSQL module: Demo
PGSQL Overview is the main dashboard for the PostgreSQL module, providing a global overview of the entire PGSQL module.
1.2 - PGSQL Alert
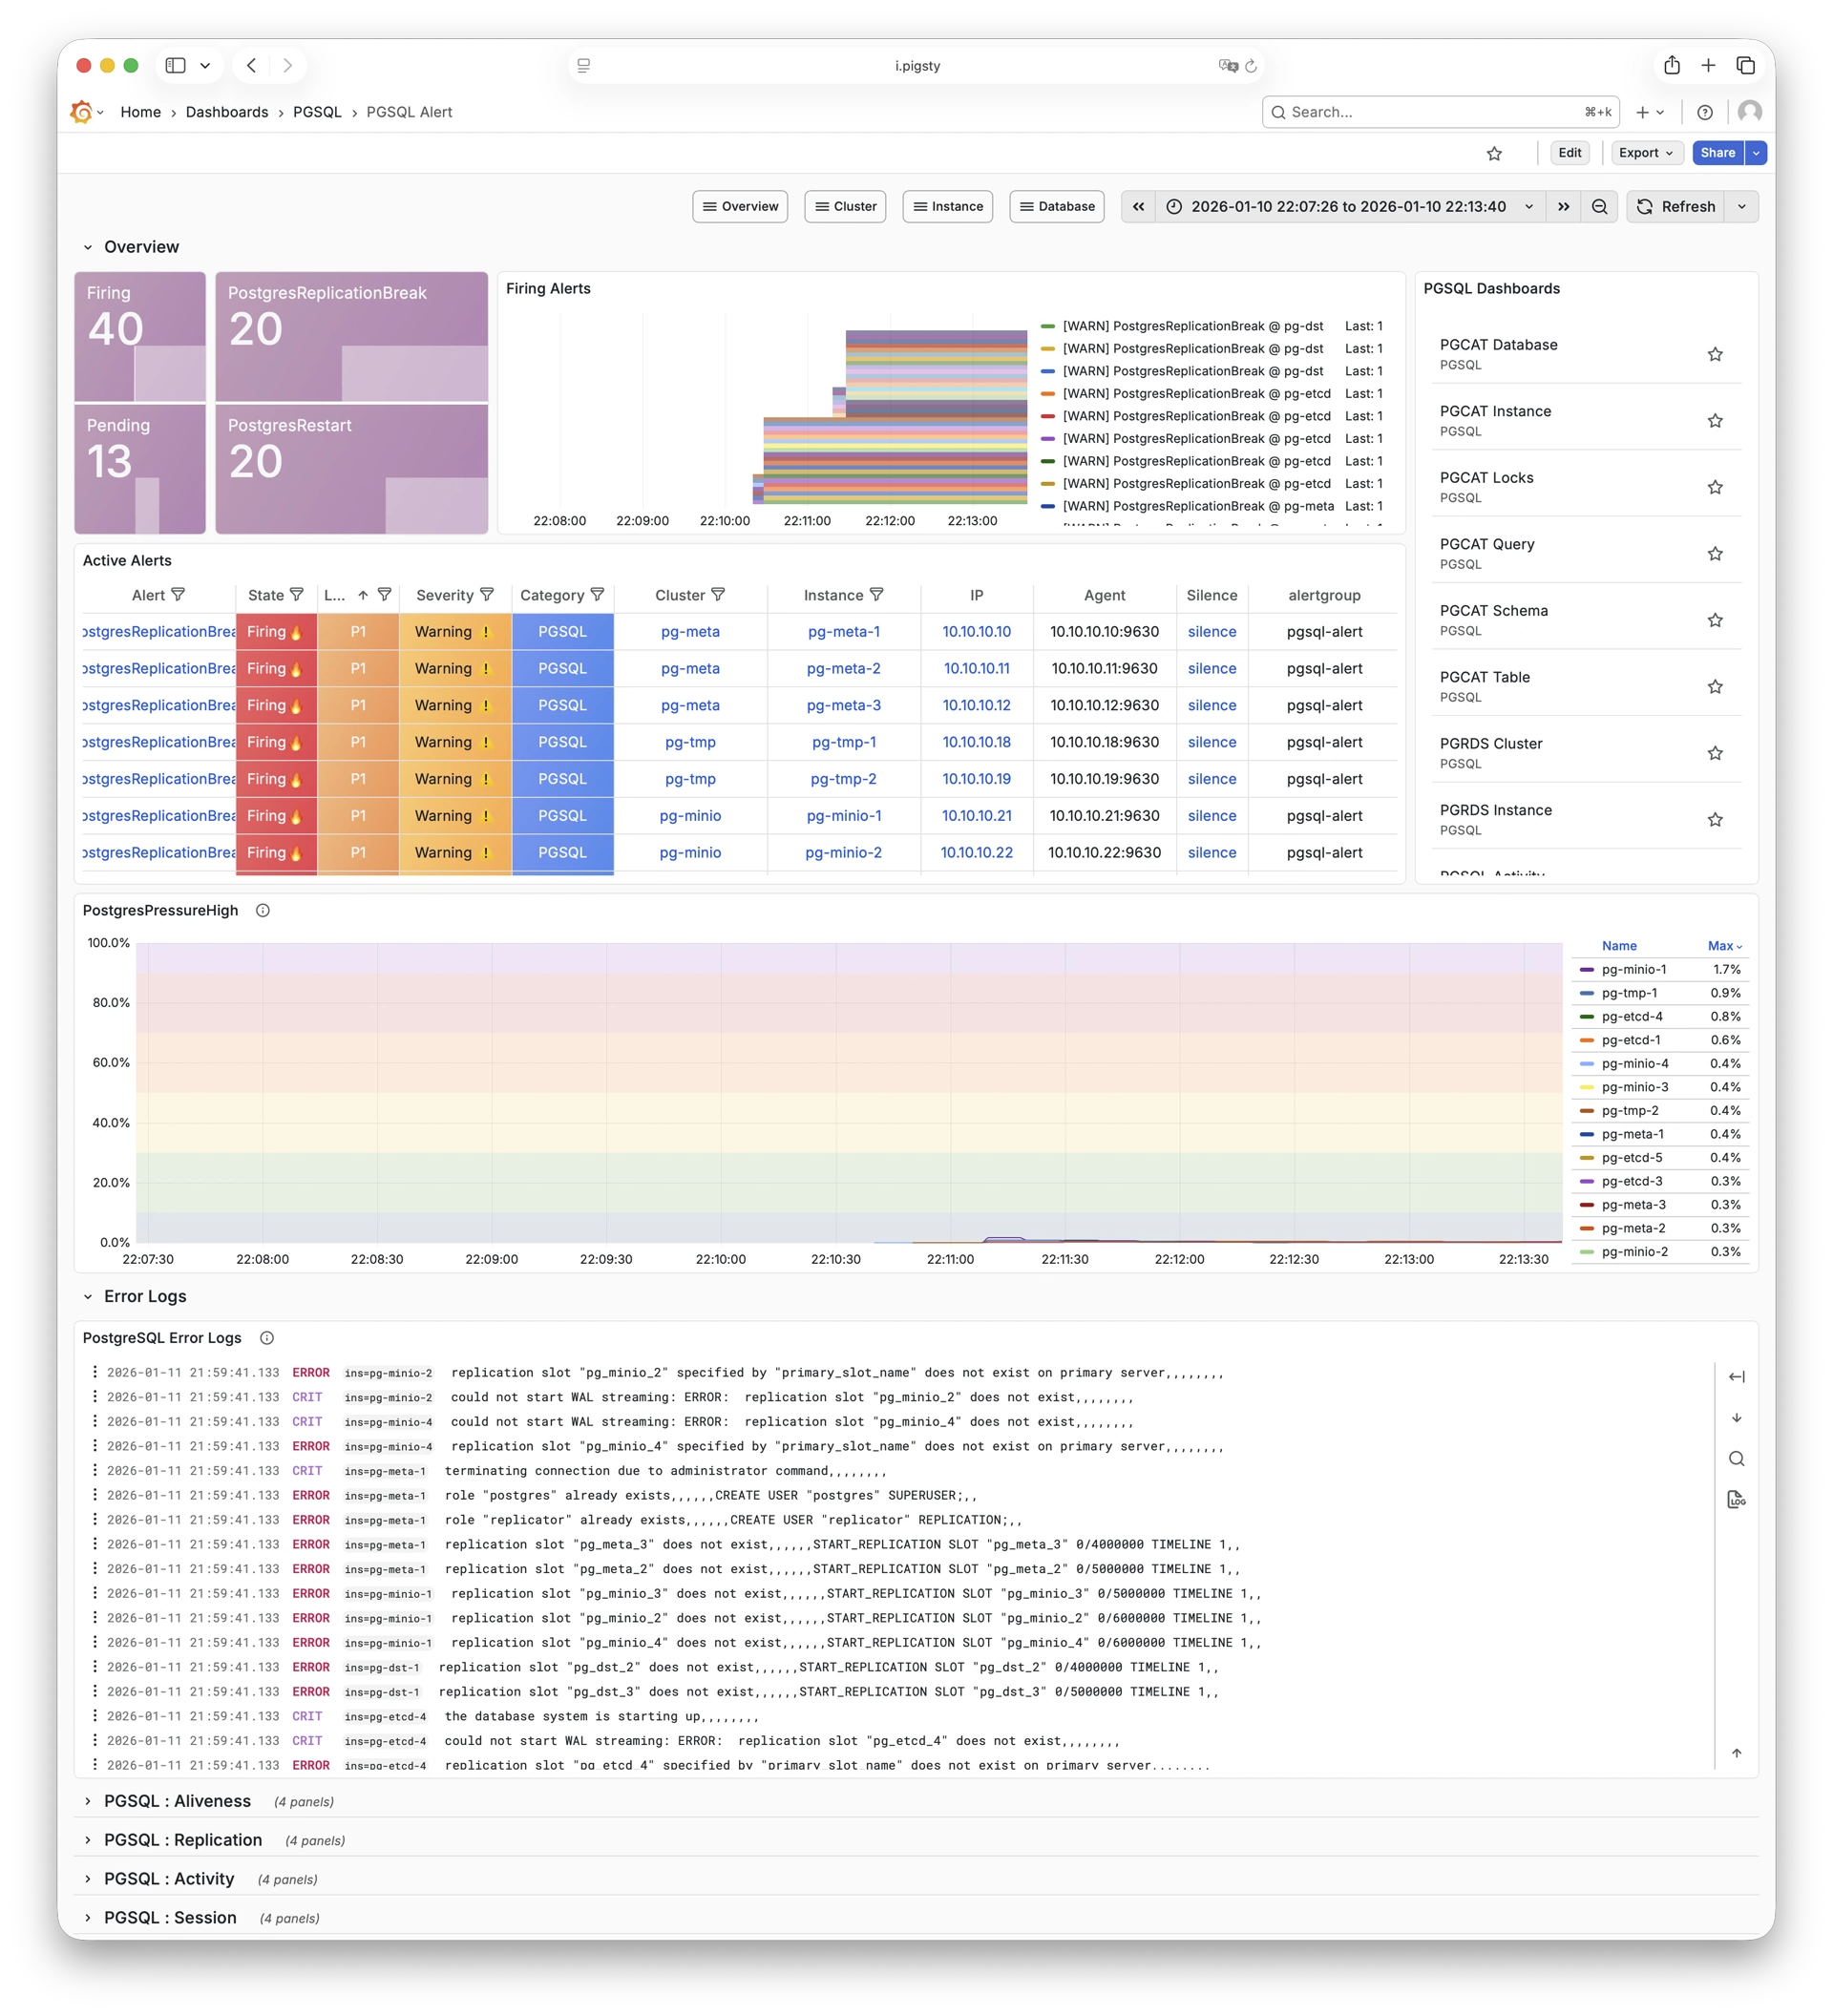
Global key metrics and alert events for PGSQL: Demo
PGSQL Alert provides a global overview of core metrics and alert events for PostgreSQL clusters.
1.3 - PGSQL Shard
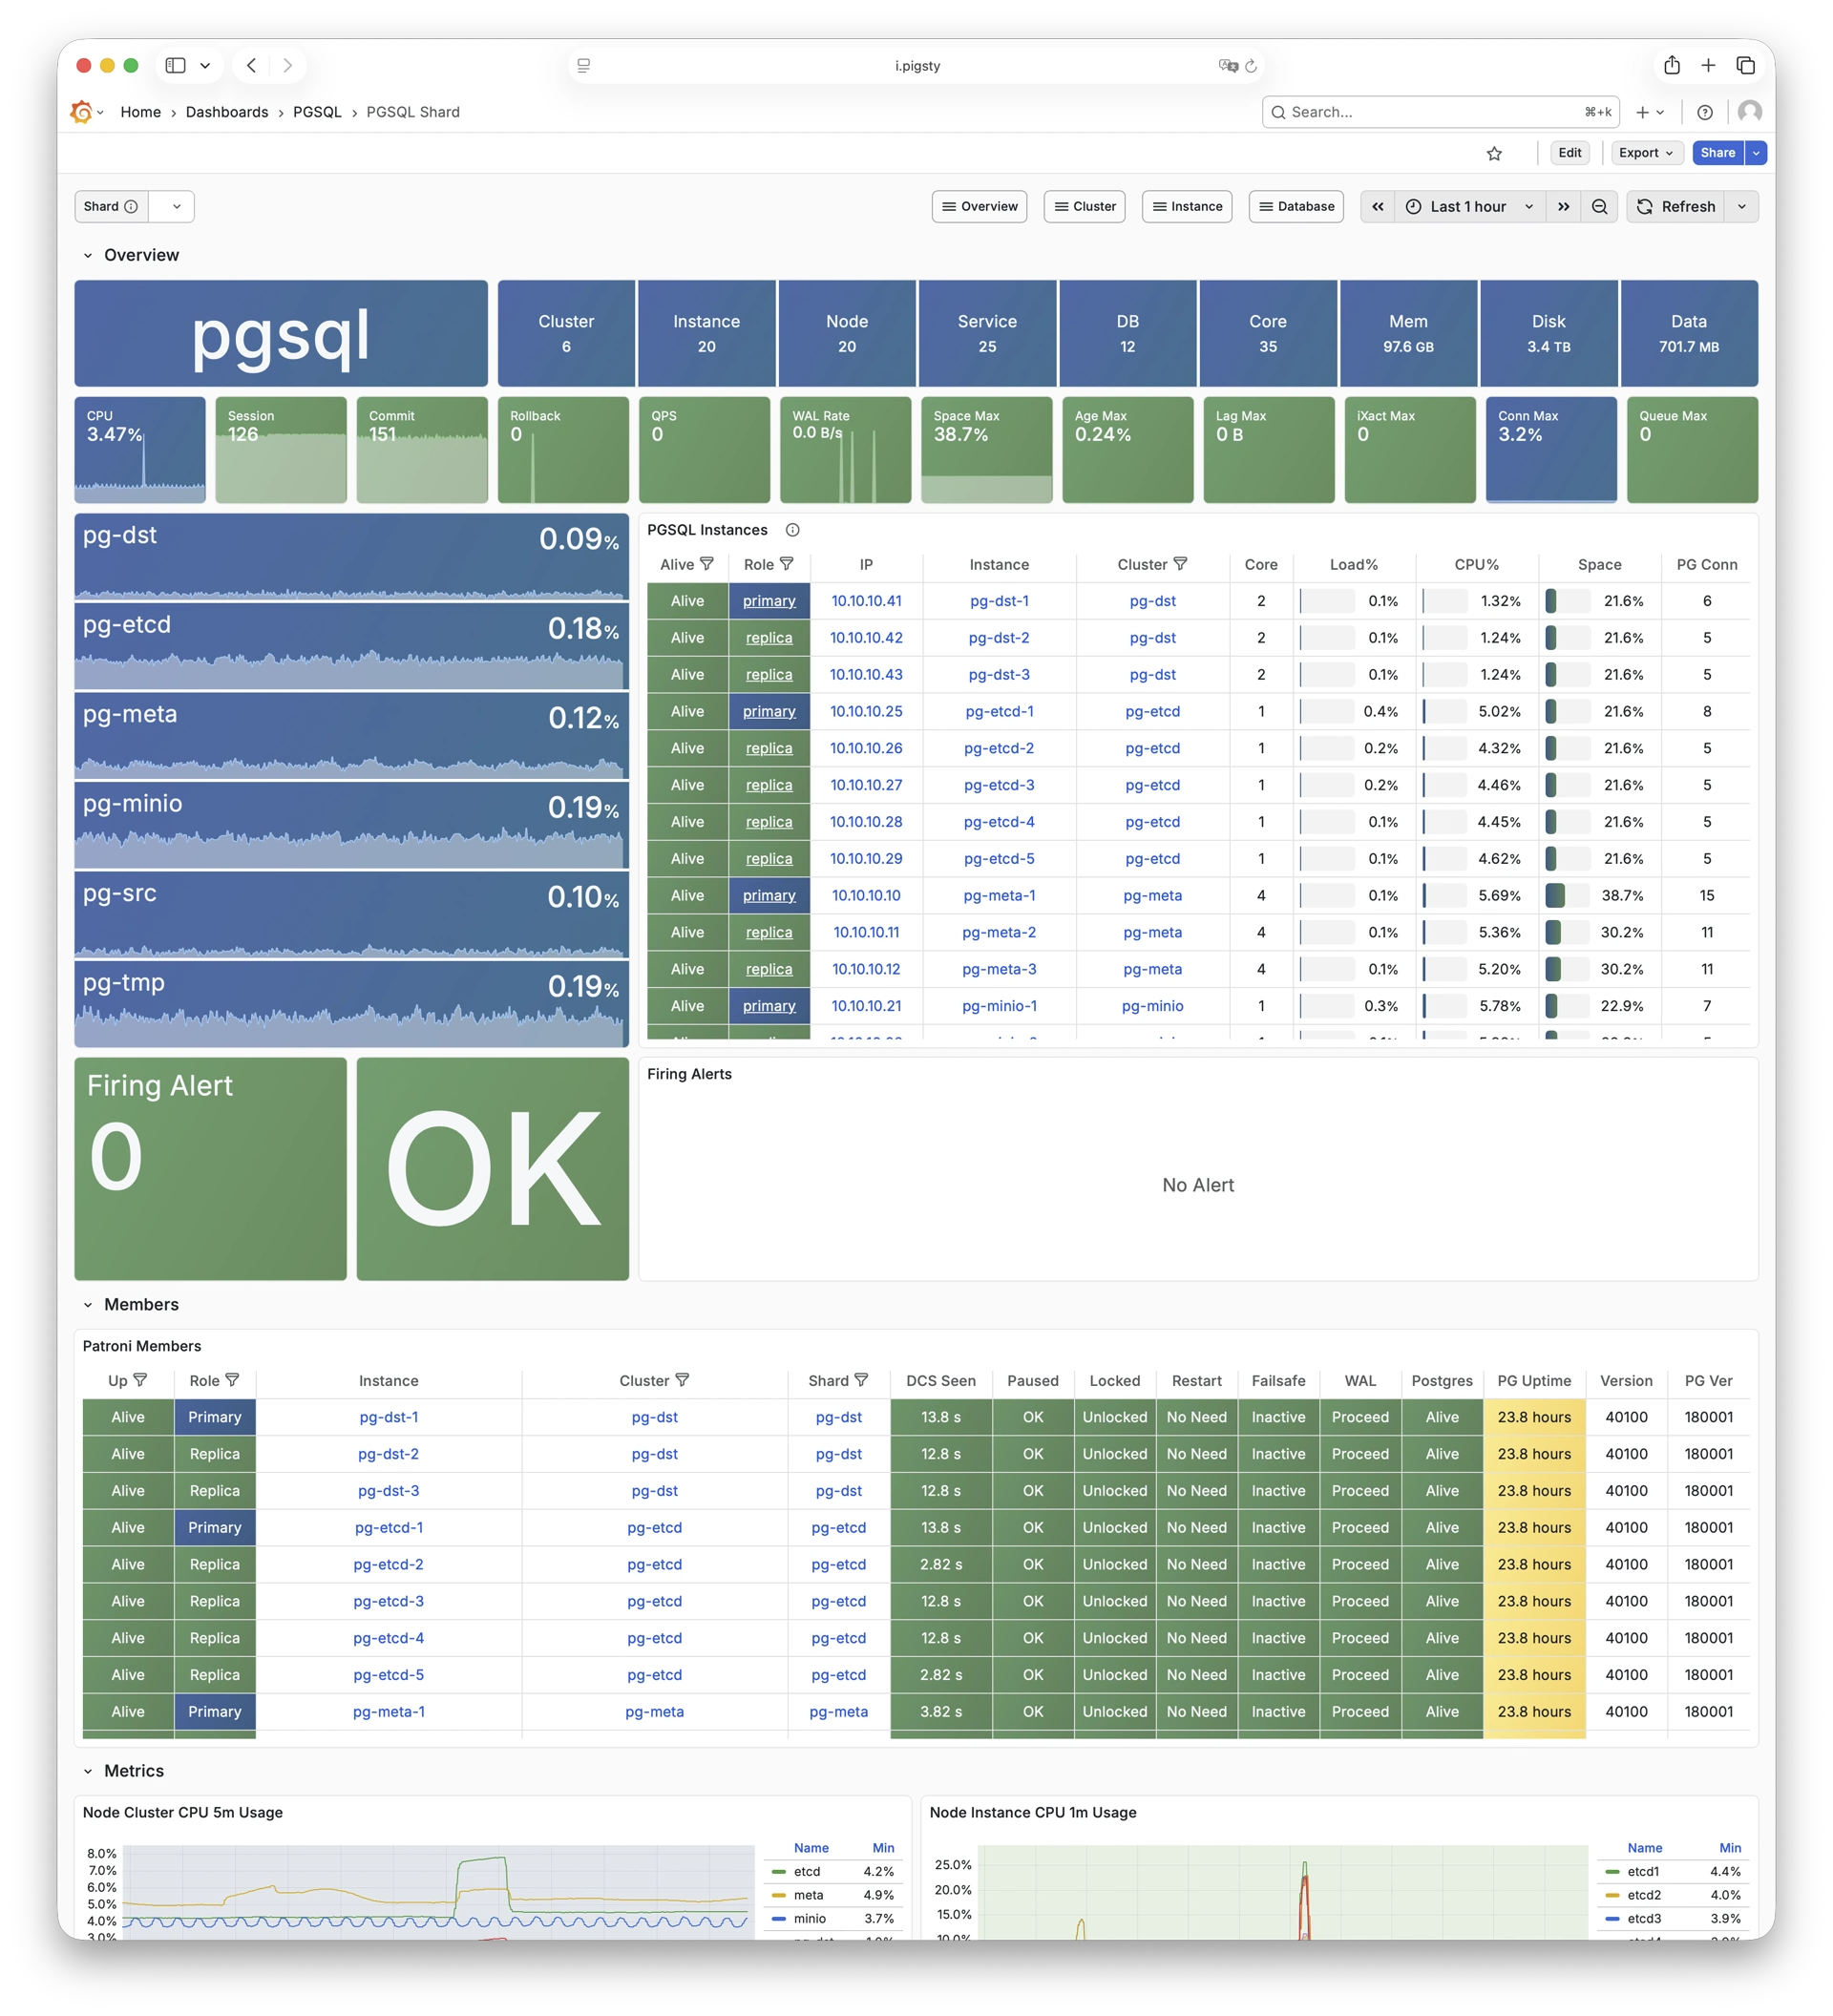
Overview of horizontally sharded PGSQL clusters: Demo
PGSQL Shard provides cross-shard metric comparison for horizontally sharded PGSQL clusters such as CITUS or GPSQL.
2 - Cluster
PostgreSQL cluster-level monitoring dashboards, including:
- PGSQL Cluster: Main dashboard for a PGSQL cluster
- PGRDS Cluster: RDS version of PGSQL Cluster, focusing on PostgreSQL-native metrics
- PGSQL Activity: Session/load/QPS/TPS/locks for PGSQL cluster
- PGSQL Replication: Replication, slots, and pub/sub for PGSQL cluster
- PGSQL Service: Service, proxy, routing, and load balancing for PGSQL cluster
- PGSQL Databases: Database CRUD, slow queries, and table statistics across all instances
- PGSQL Patroni: HA status and Patroni component status for cluster
- PGSQL PITR: PITR context for point-in-time recovery assistance
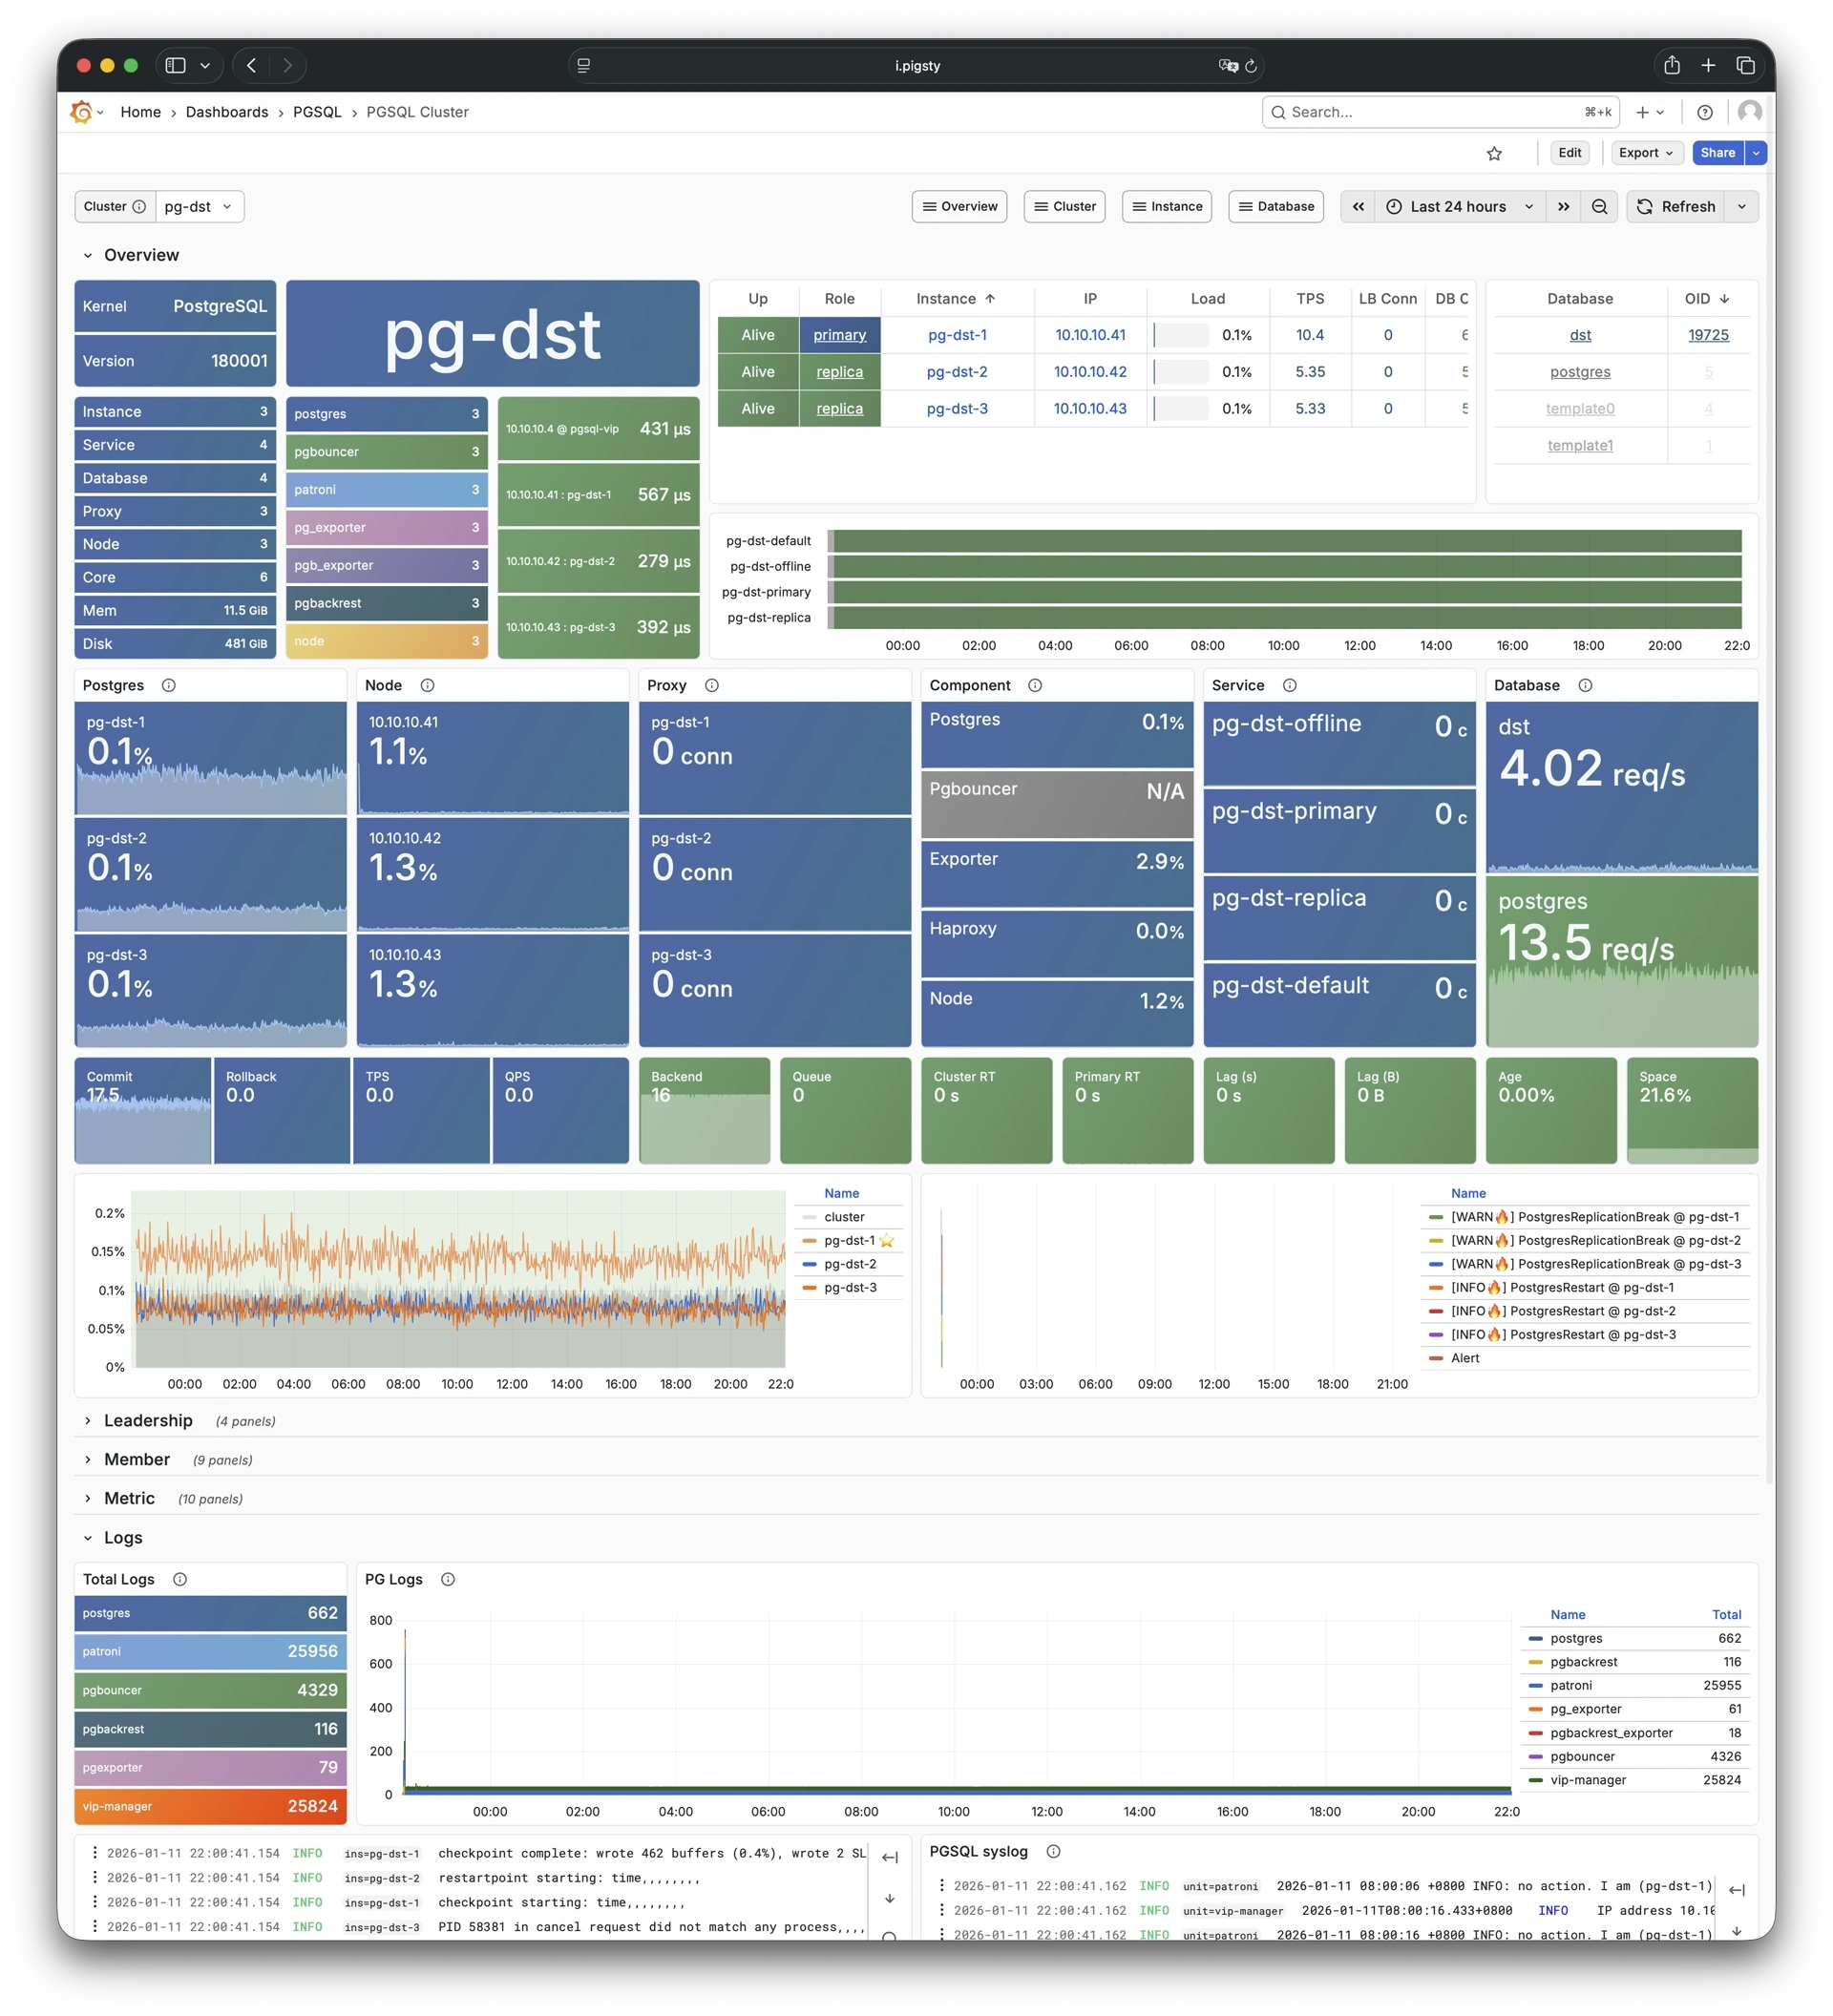
2.1 - PGSQL Cluster
Main dashboard for a PGSQL cluster: Demo
PGSQL Cluster is the main dashboard for a single PostgreSQL cluster, providing cluster-level core metrics overview.
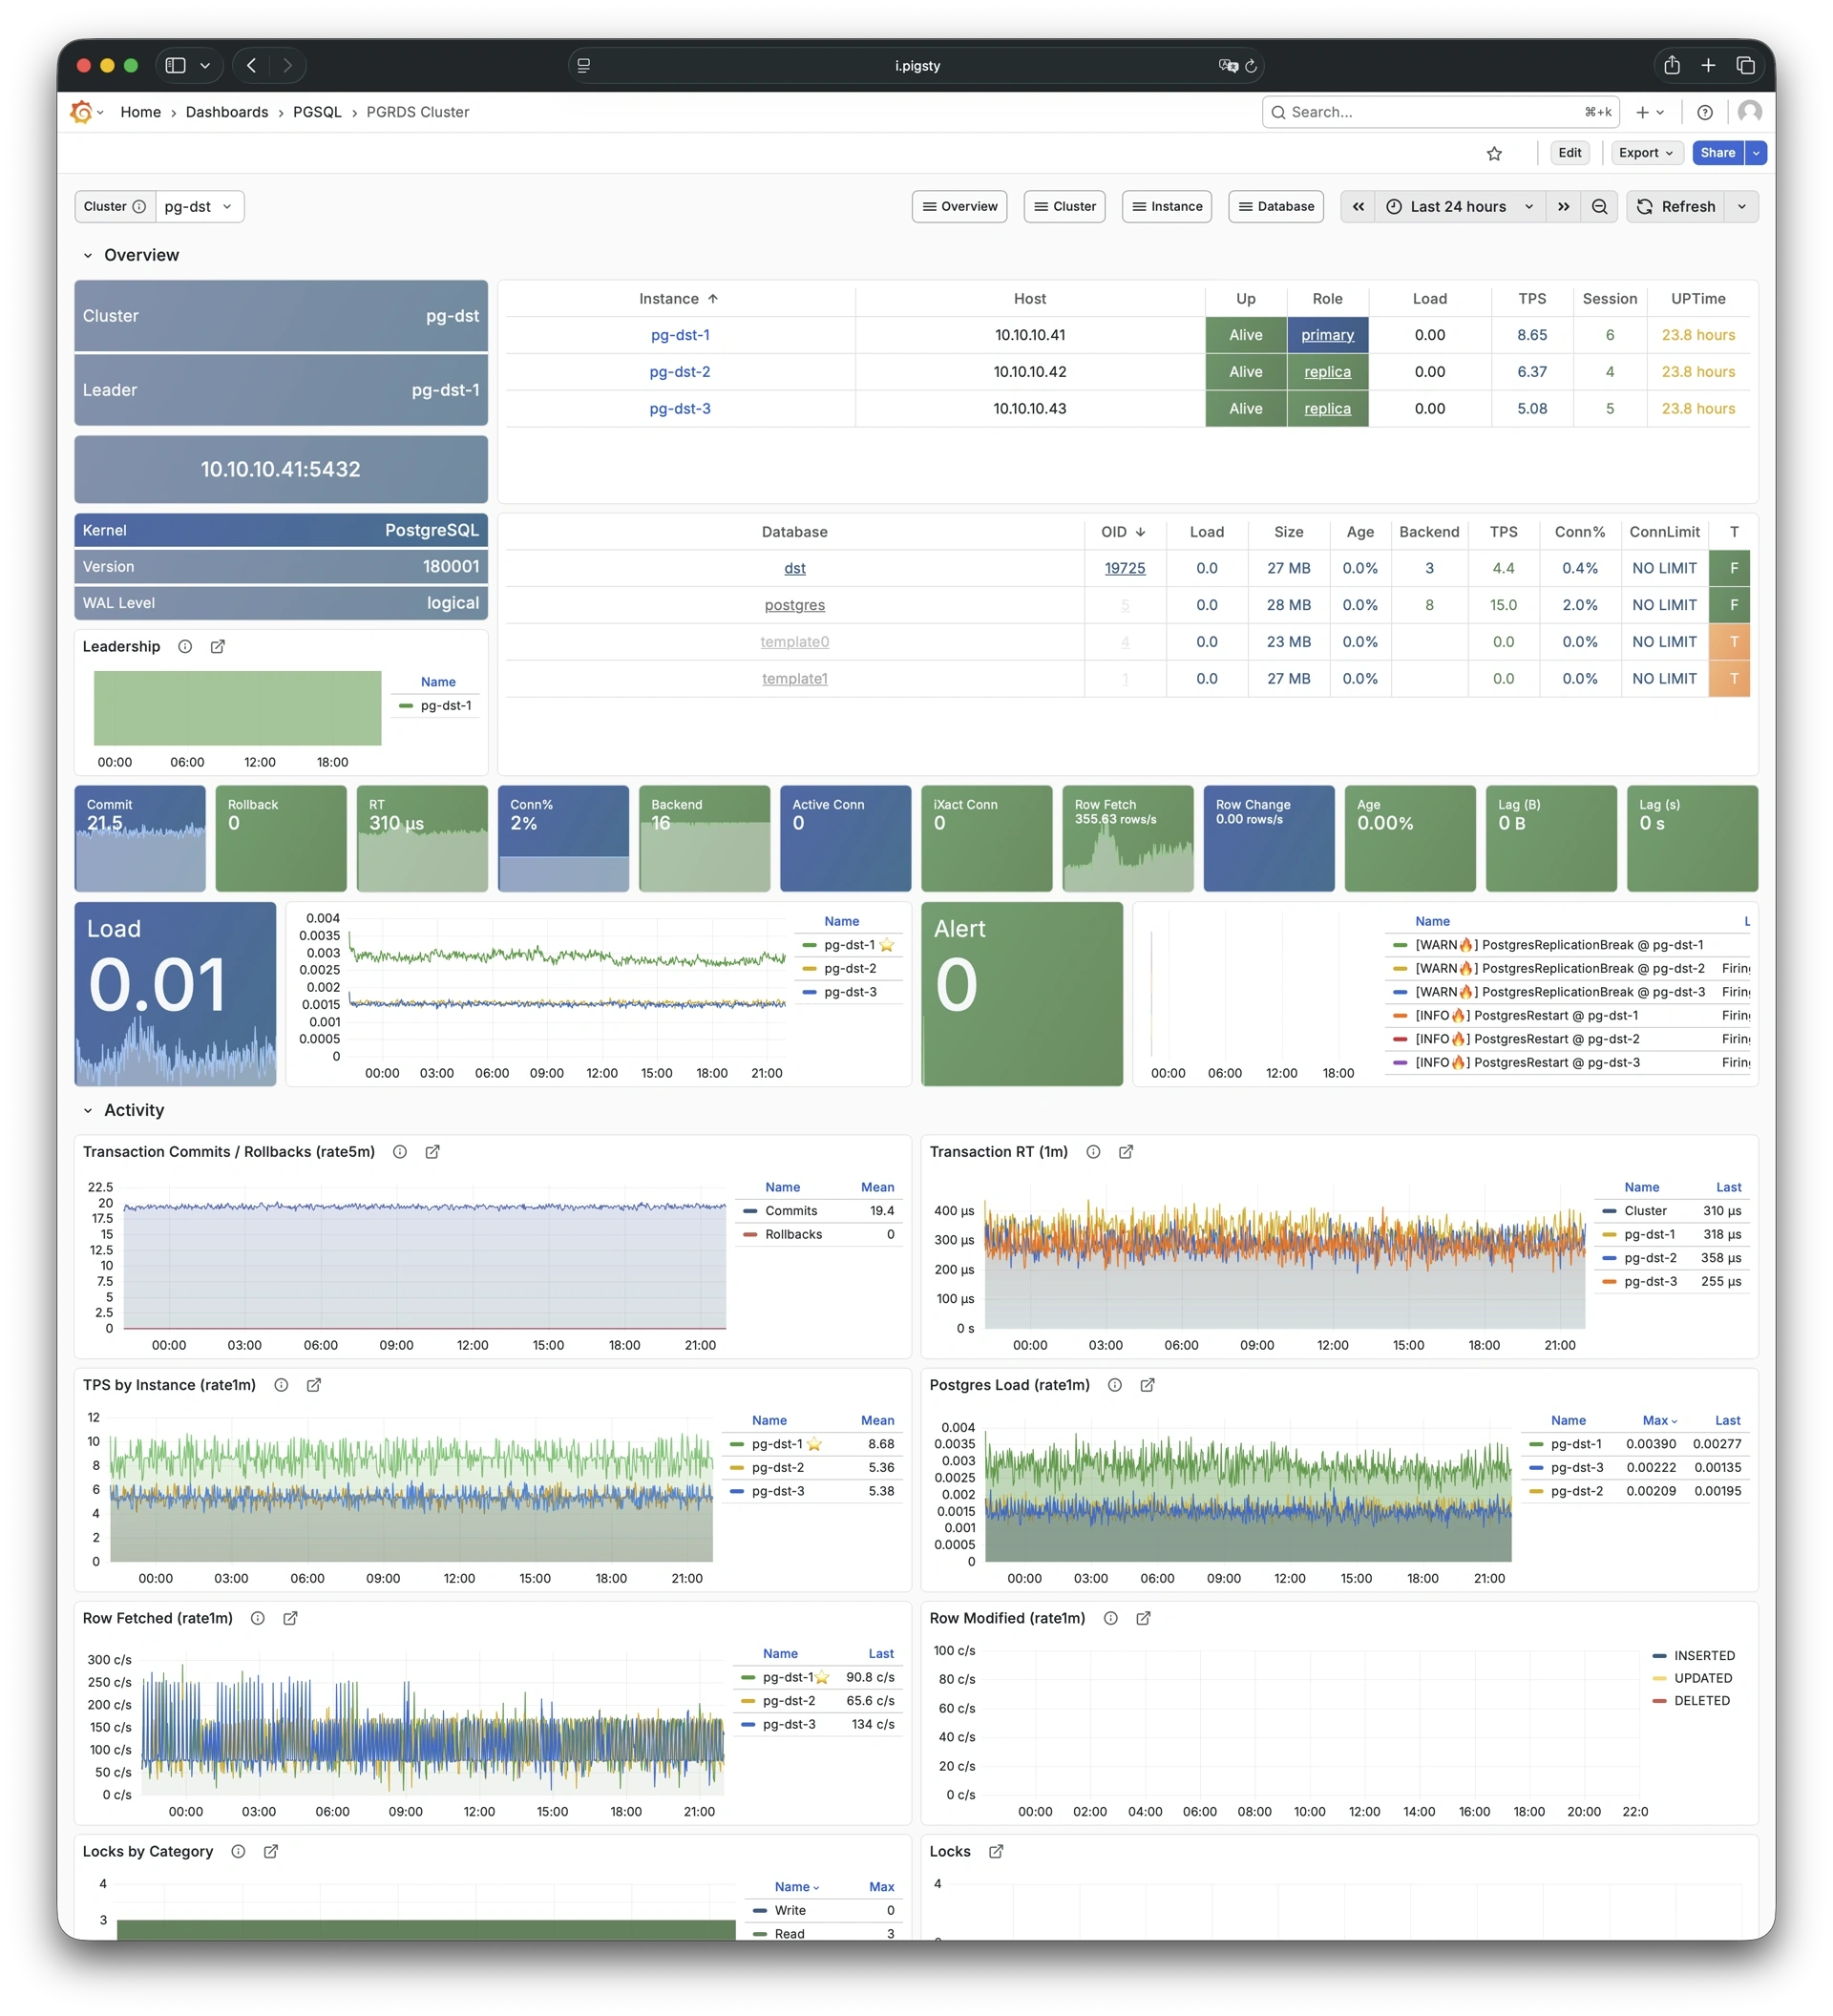
2.2 - PGRDS Cluster
RDS version of PGSQL Cluster: Demo
PGRDS Cluster is the RDS version of PGSQL Cluster, focusing on PostgreSQL-native metrics without host-level metrics.
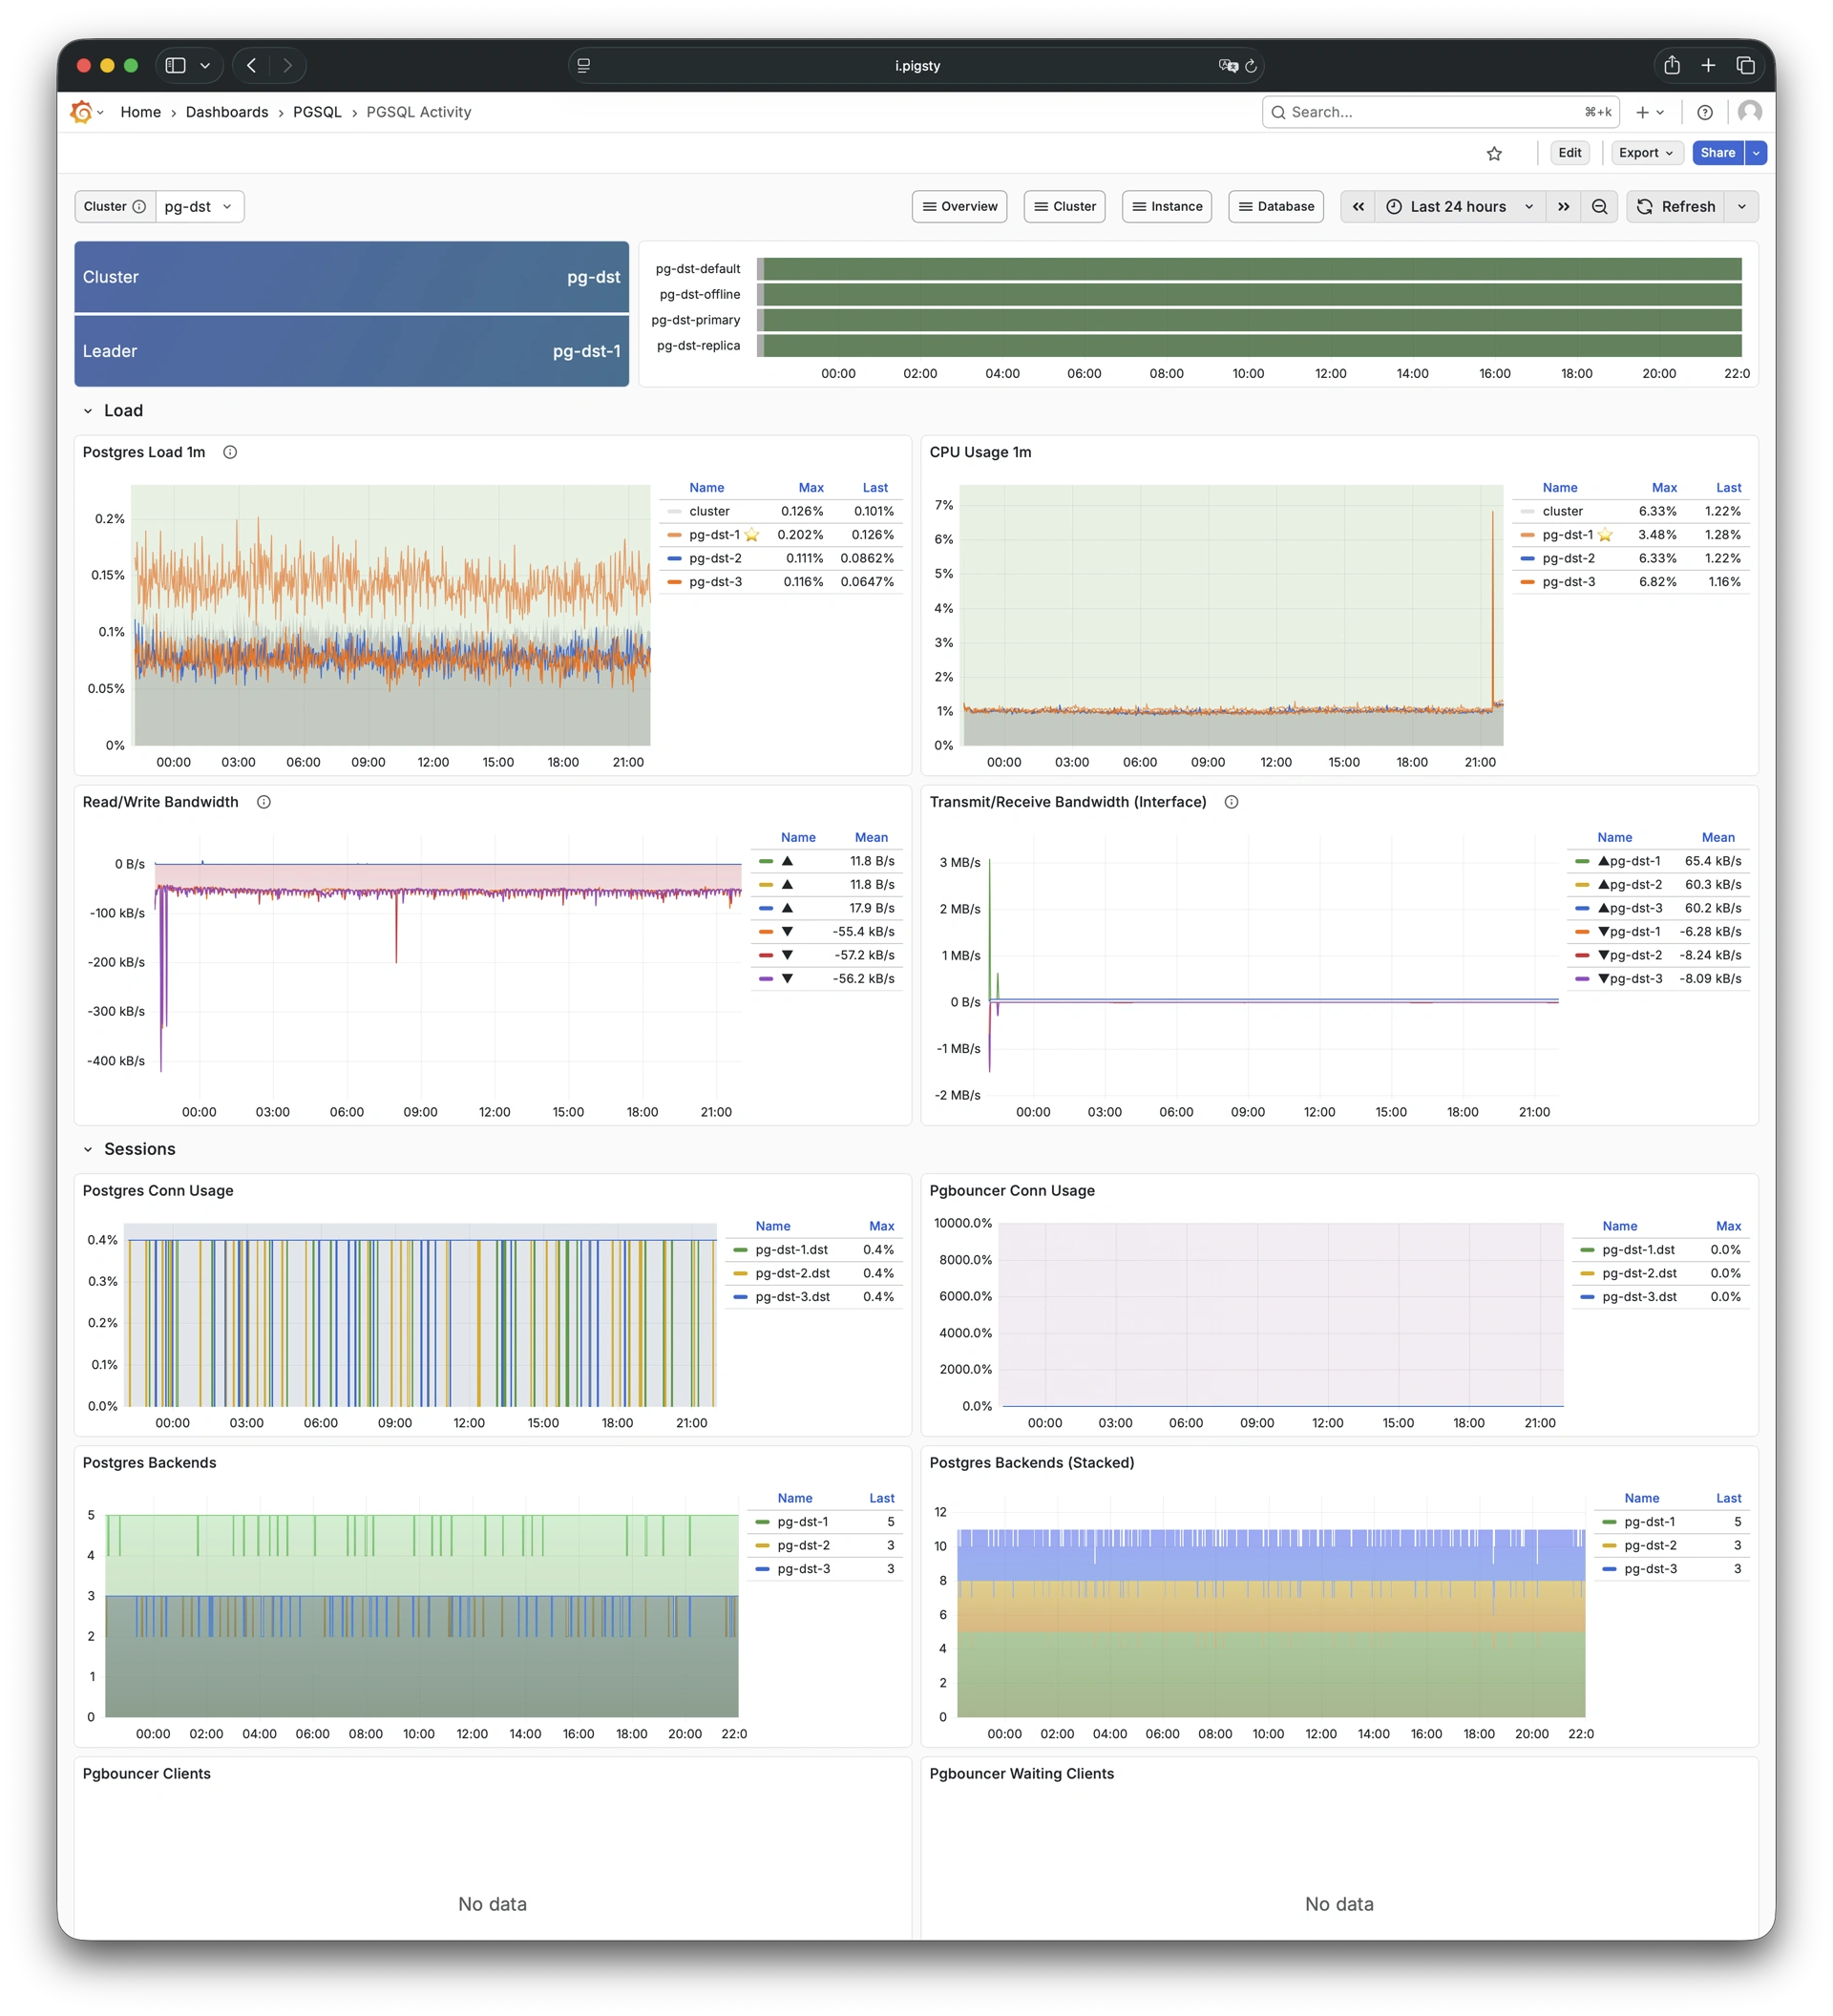
2.3 - PGSQL Activity
Session/load/QPS/TPS/locks for PGSQL cluster: Demo
PGSQL Activity focuses on session activity, load, QPS, TPS, and lock status for a PostgreSQL cluster.
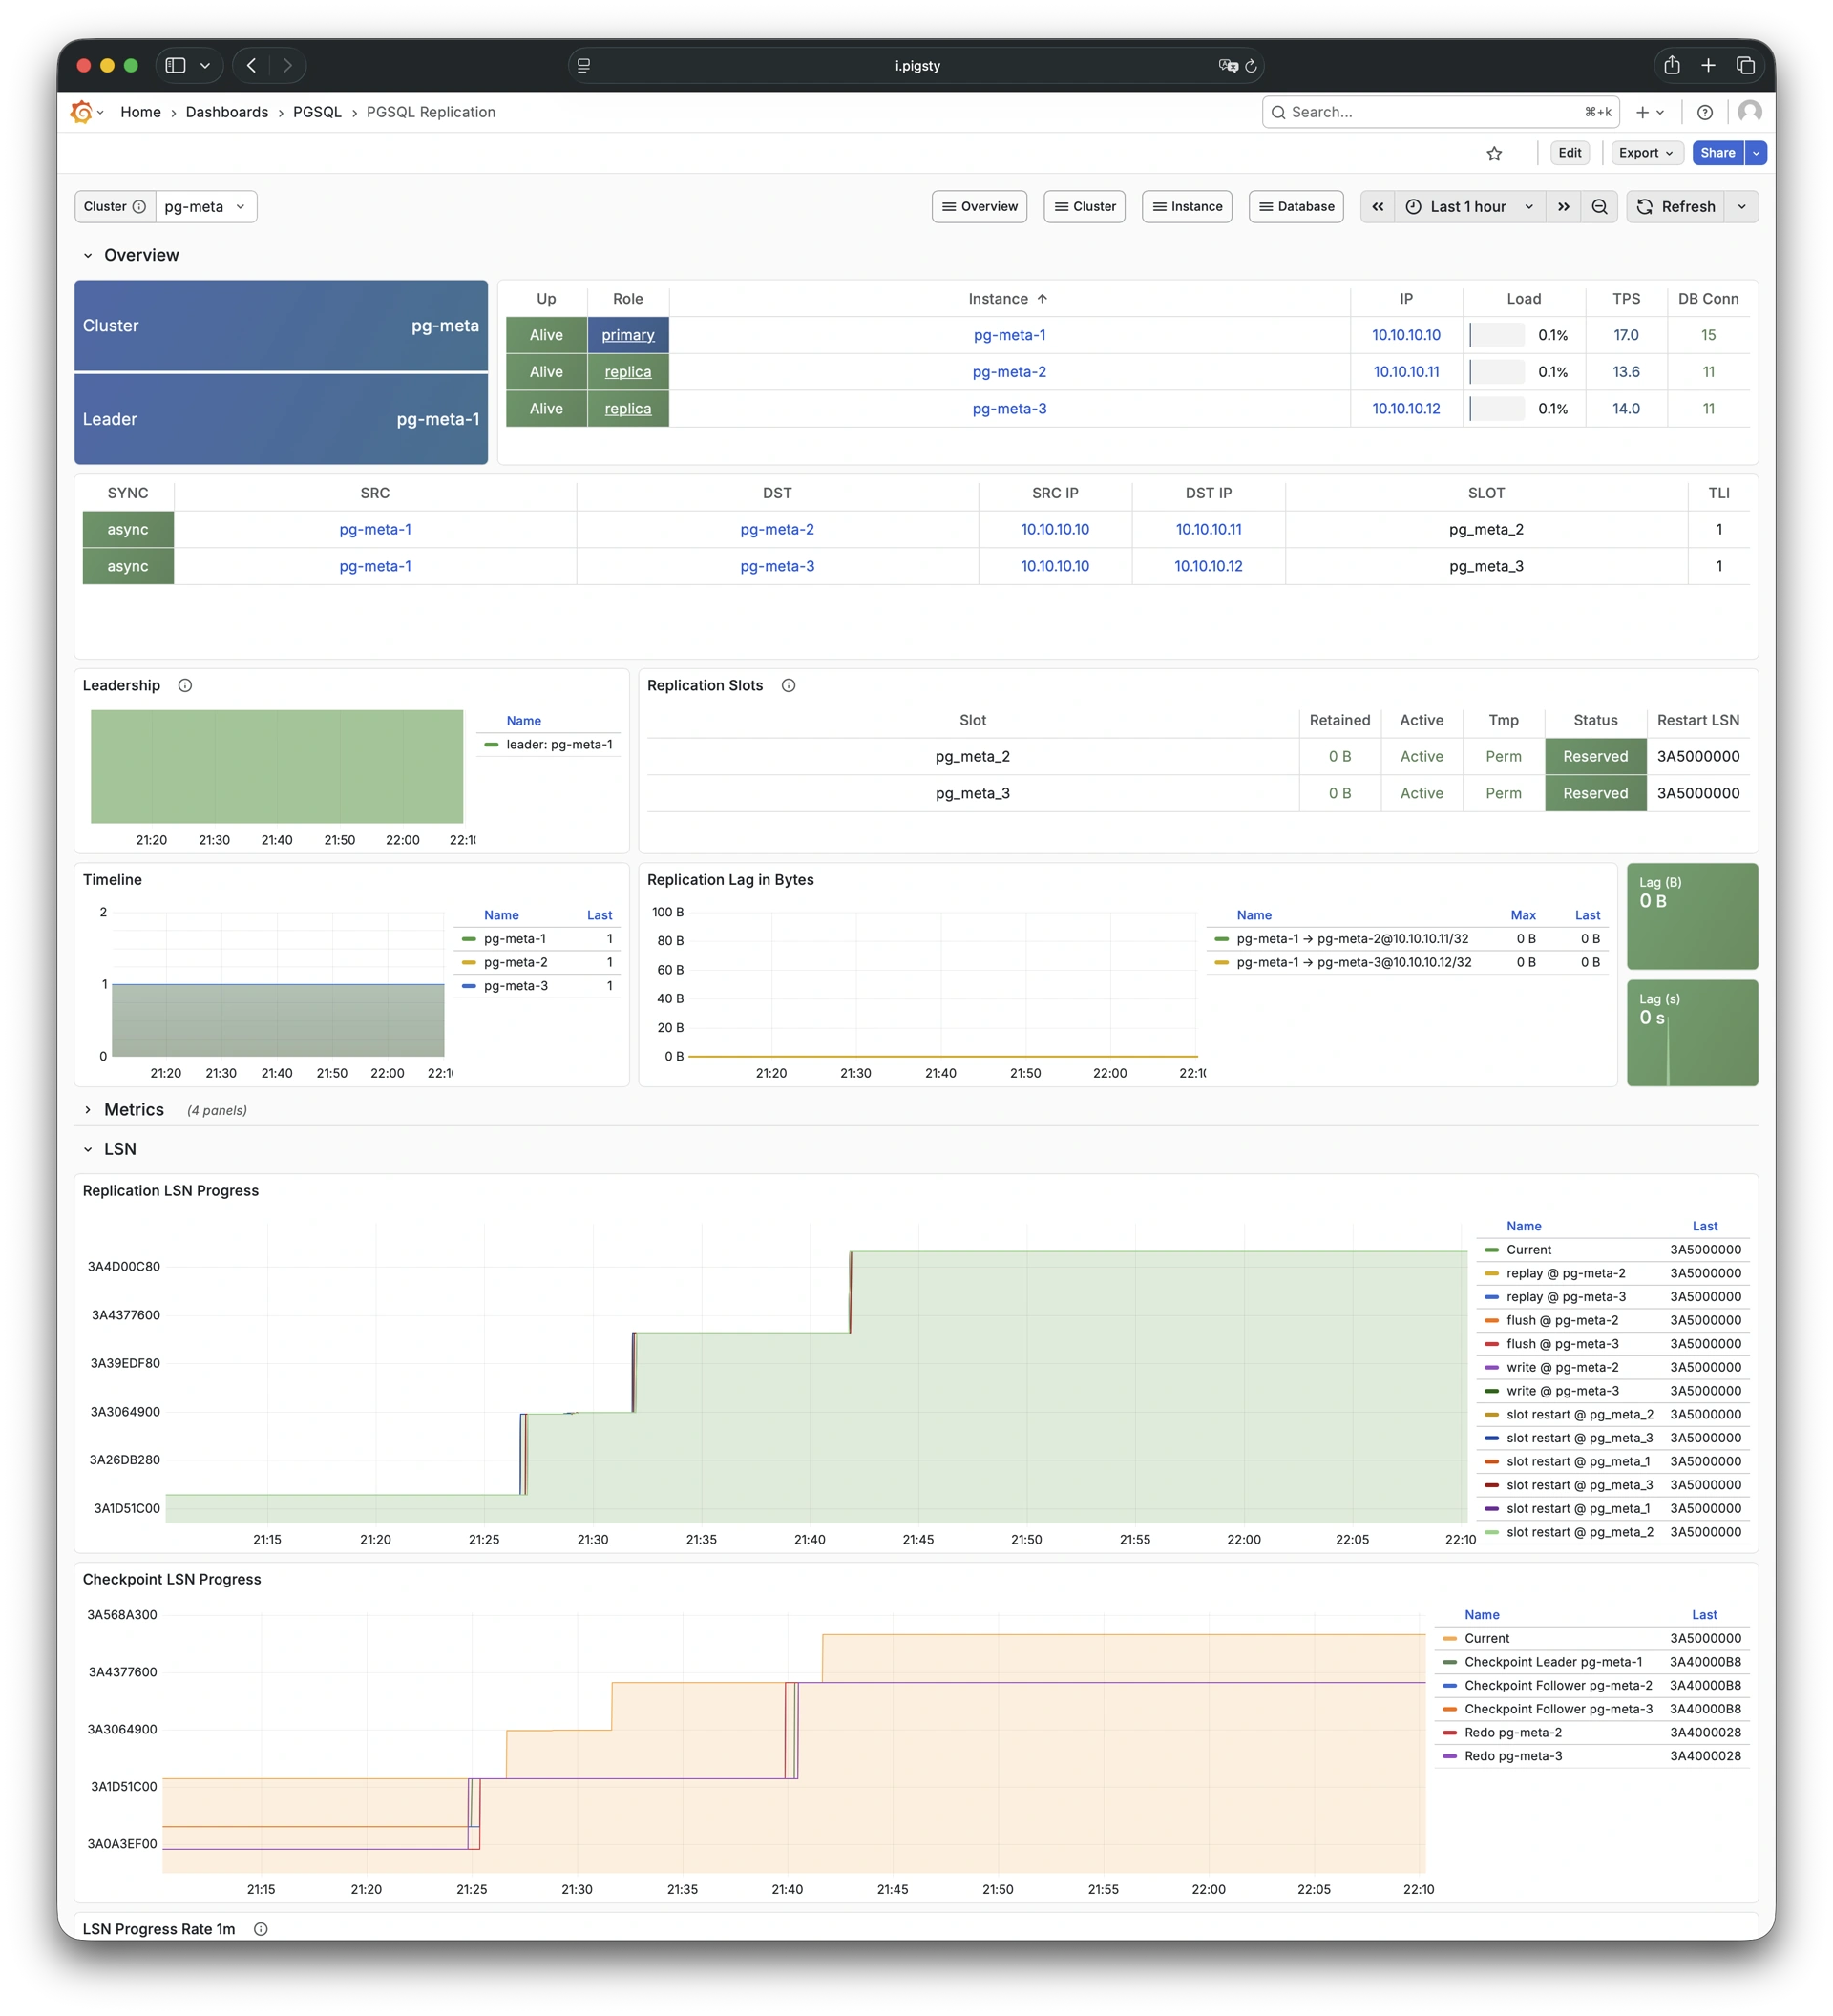
2.4 - PGSQL Replication
Replication, slots, and pub/sub for PGSQL cluster: Demo
PGSQL Replication focuses on replication status, replication slots, and logical replication (pub/sub) for a PostgreSQL cluster.
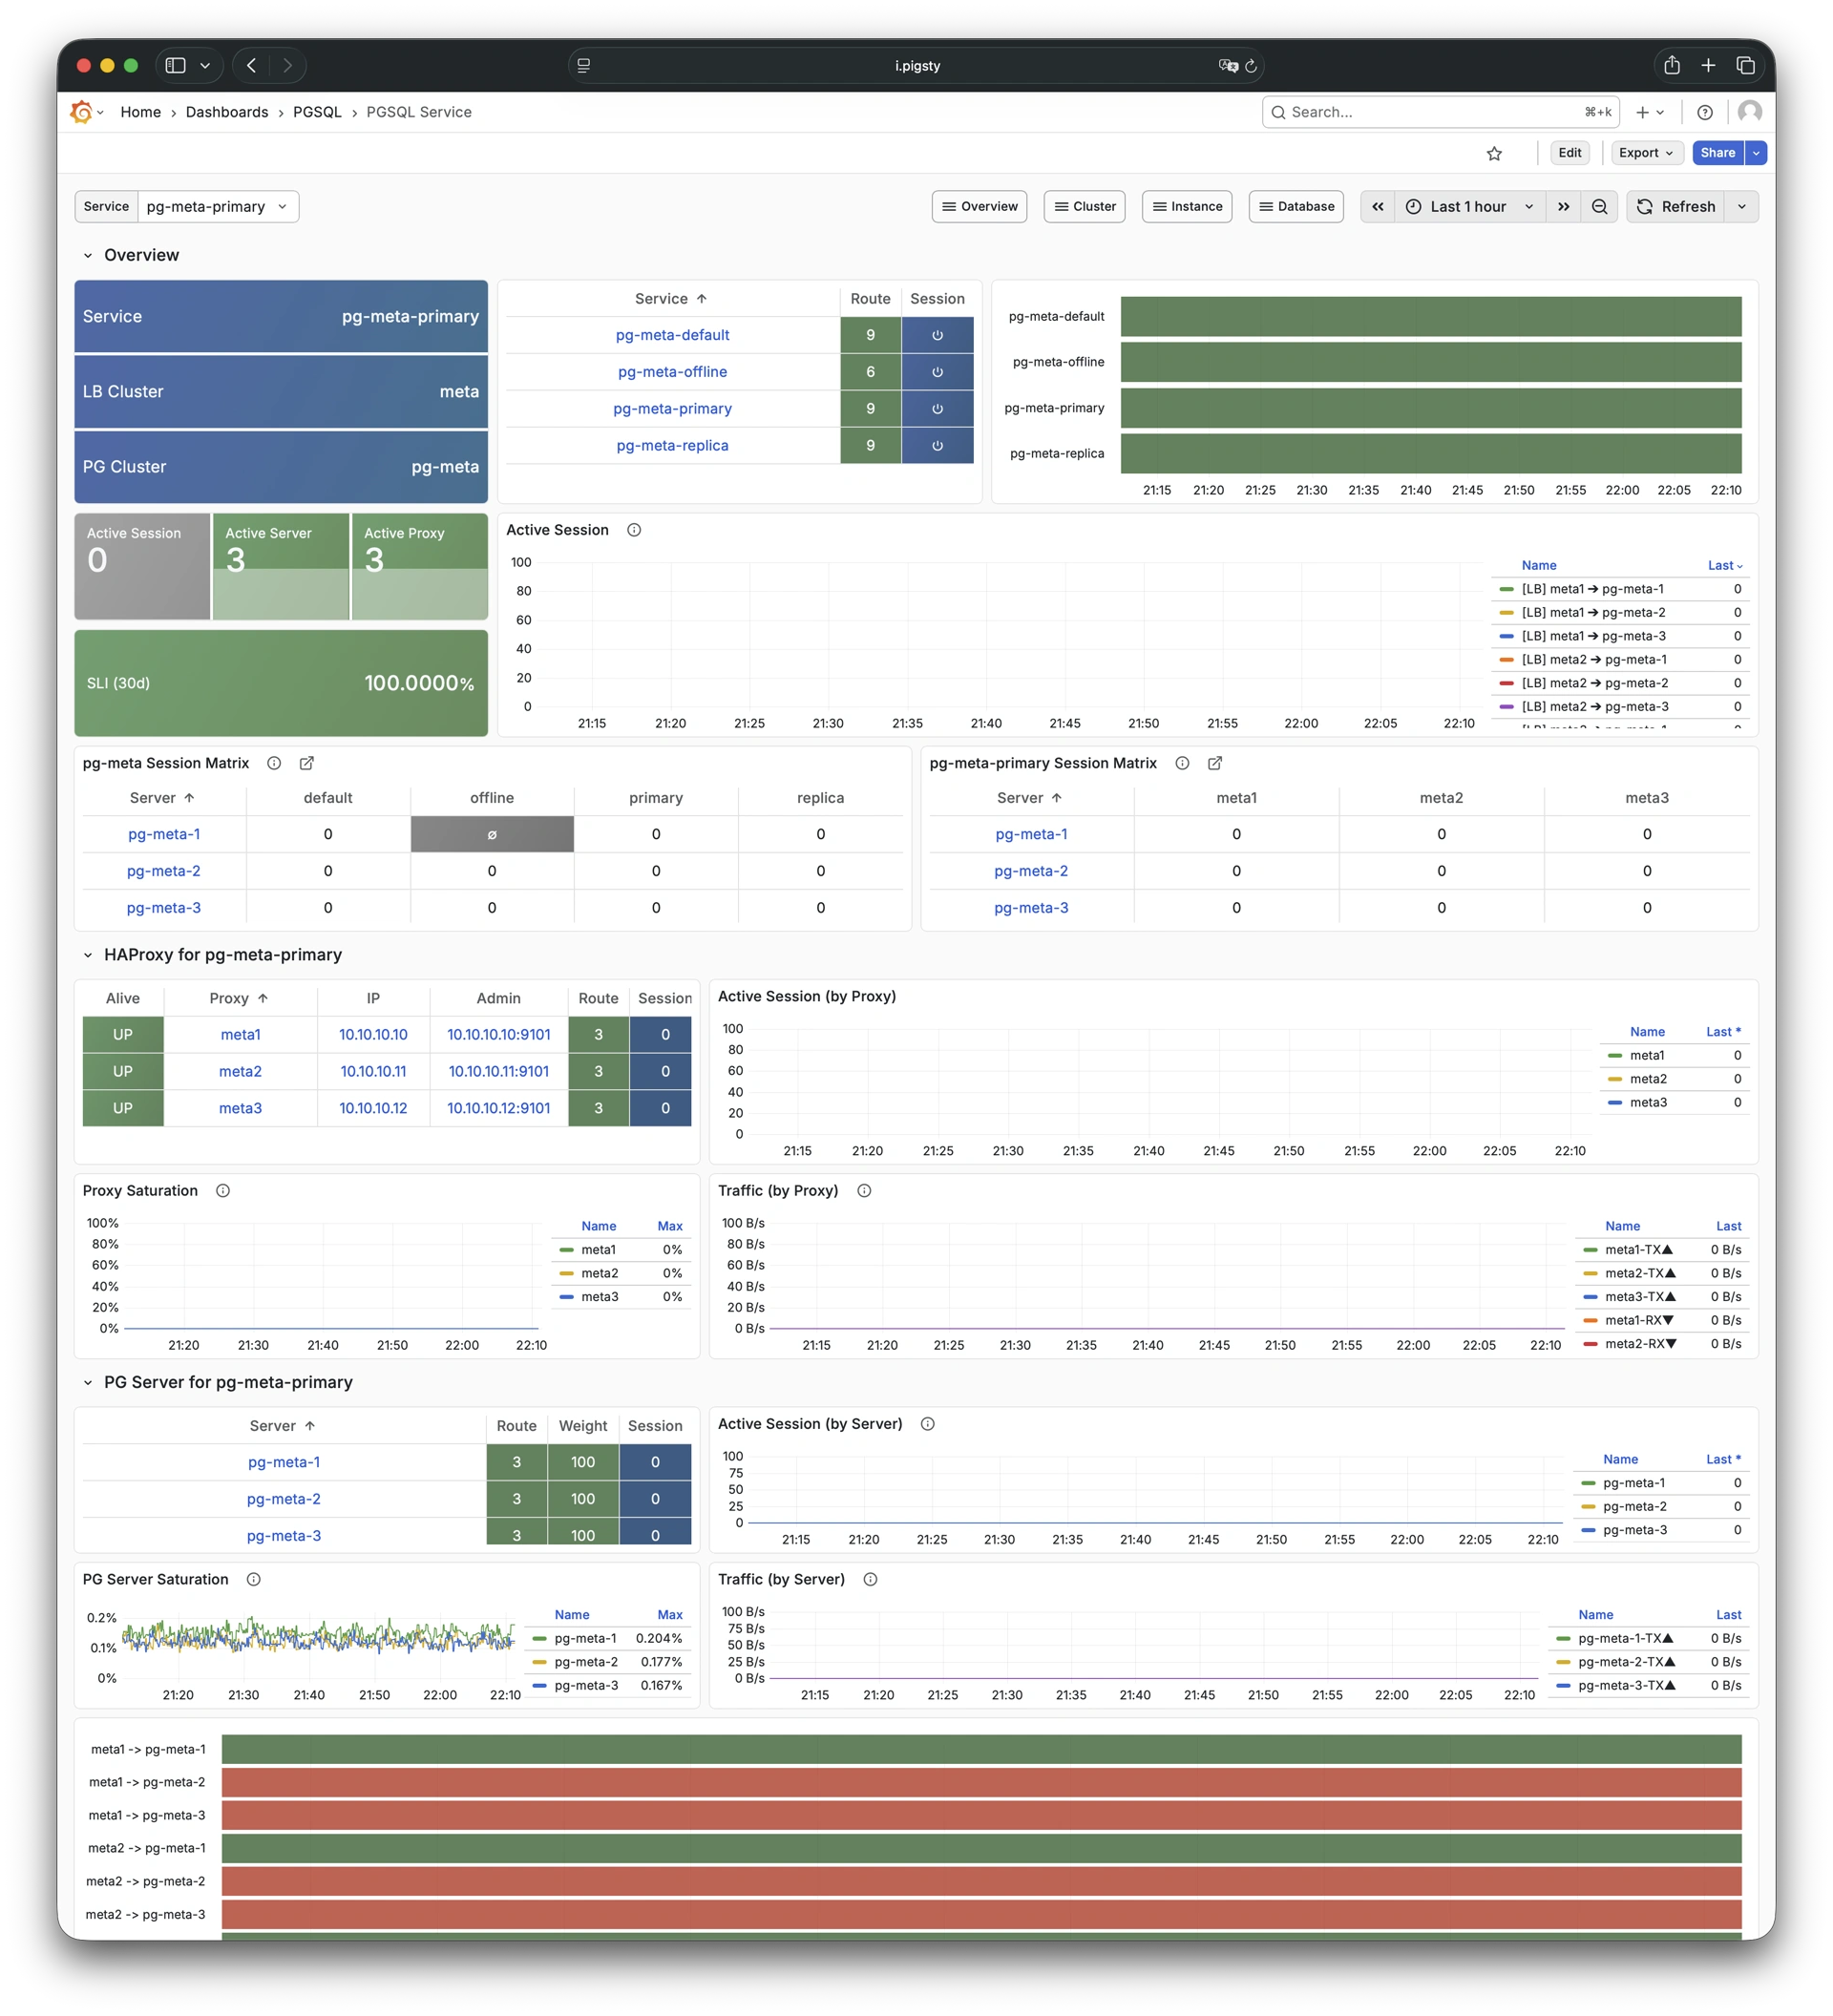
2.5 - PGSQL Service
Service, proxy, routing, and load balancing for PGSQL cluster: Demo
PGSQL Service focuses on service endpoints, proxy routing, and load balancing status for a PostgreSQL cluster.
2.6 - PGSQL Databases
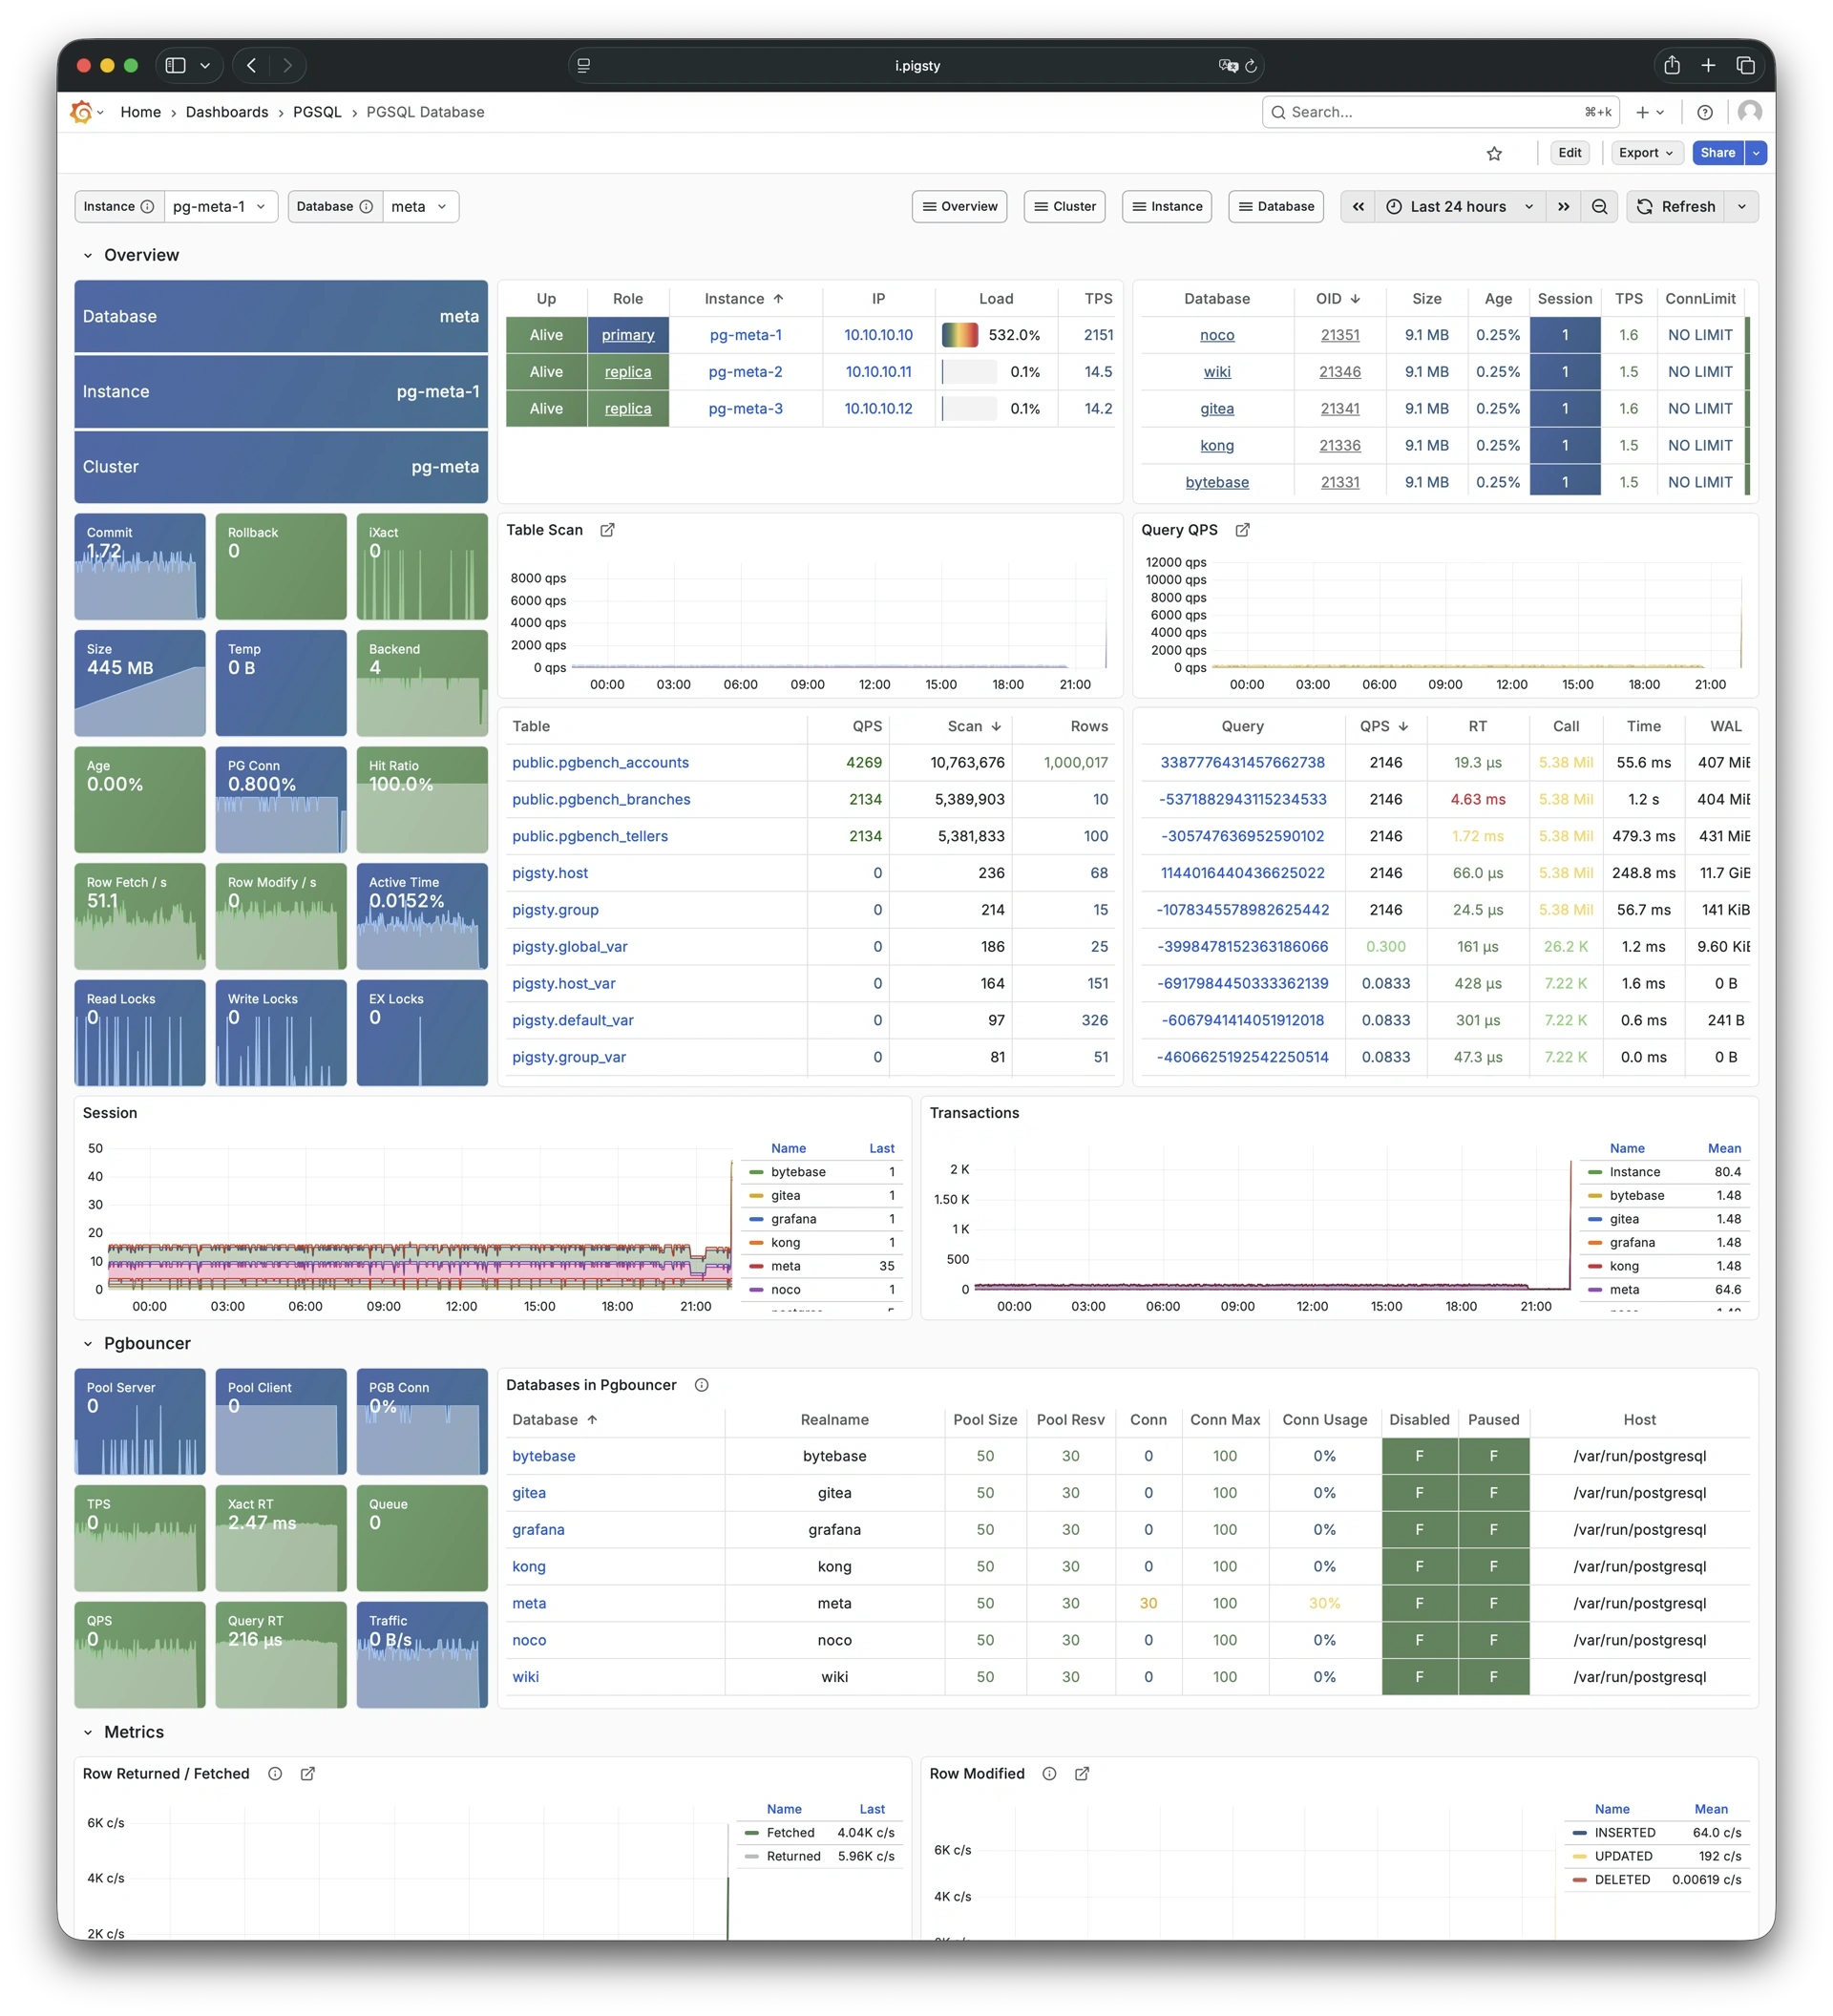
Database CRUD, slow queries, and table statistics: Demo
PGSQL Databases focuses on database-level CRUD operations, slow queries, and table statistics across all instances in a cluster.
2.7 - PGSQL Patroni
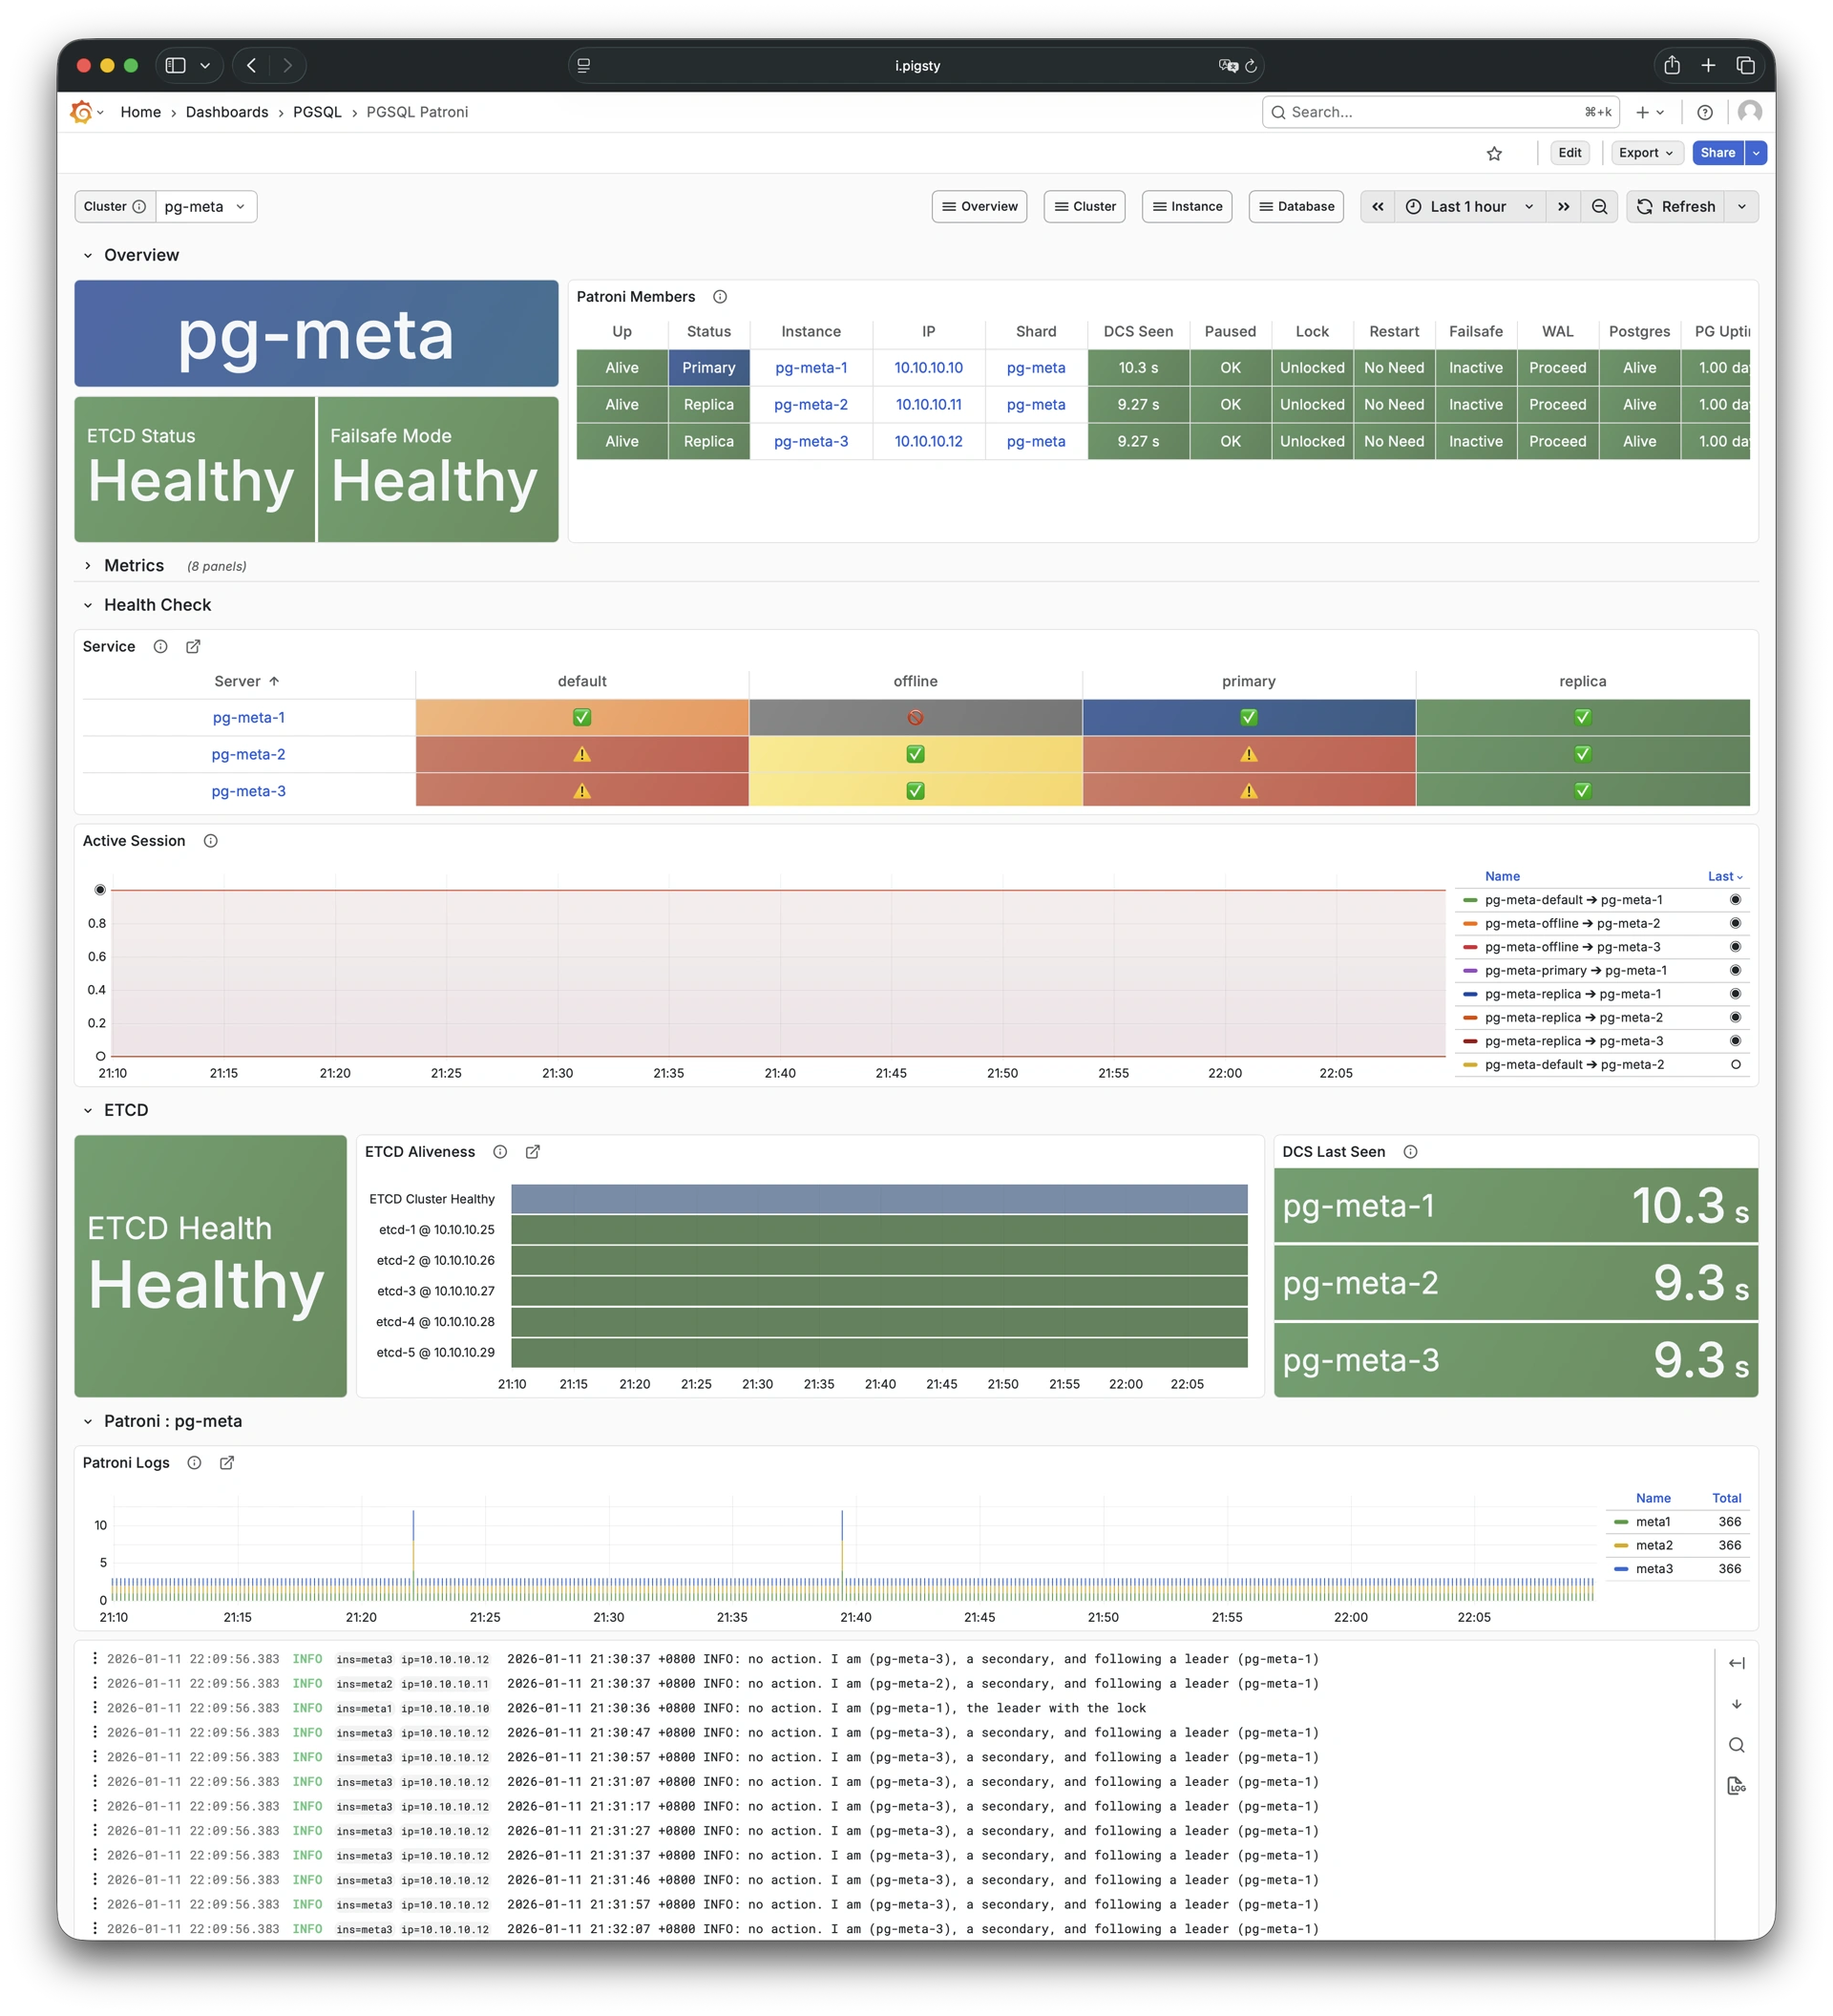
HA status and Patroni component status: Demo
PGSQL Patroni focuses on high-availability status and Patroni component health for a PostgreSQL cluster.
2.8 - PGSQL PITR
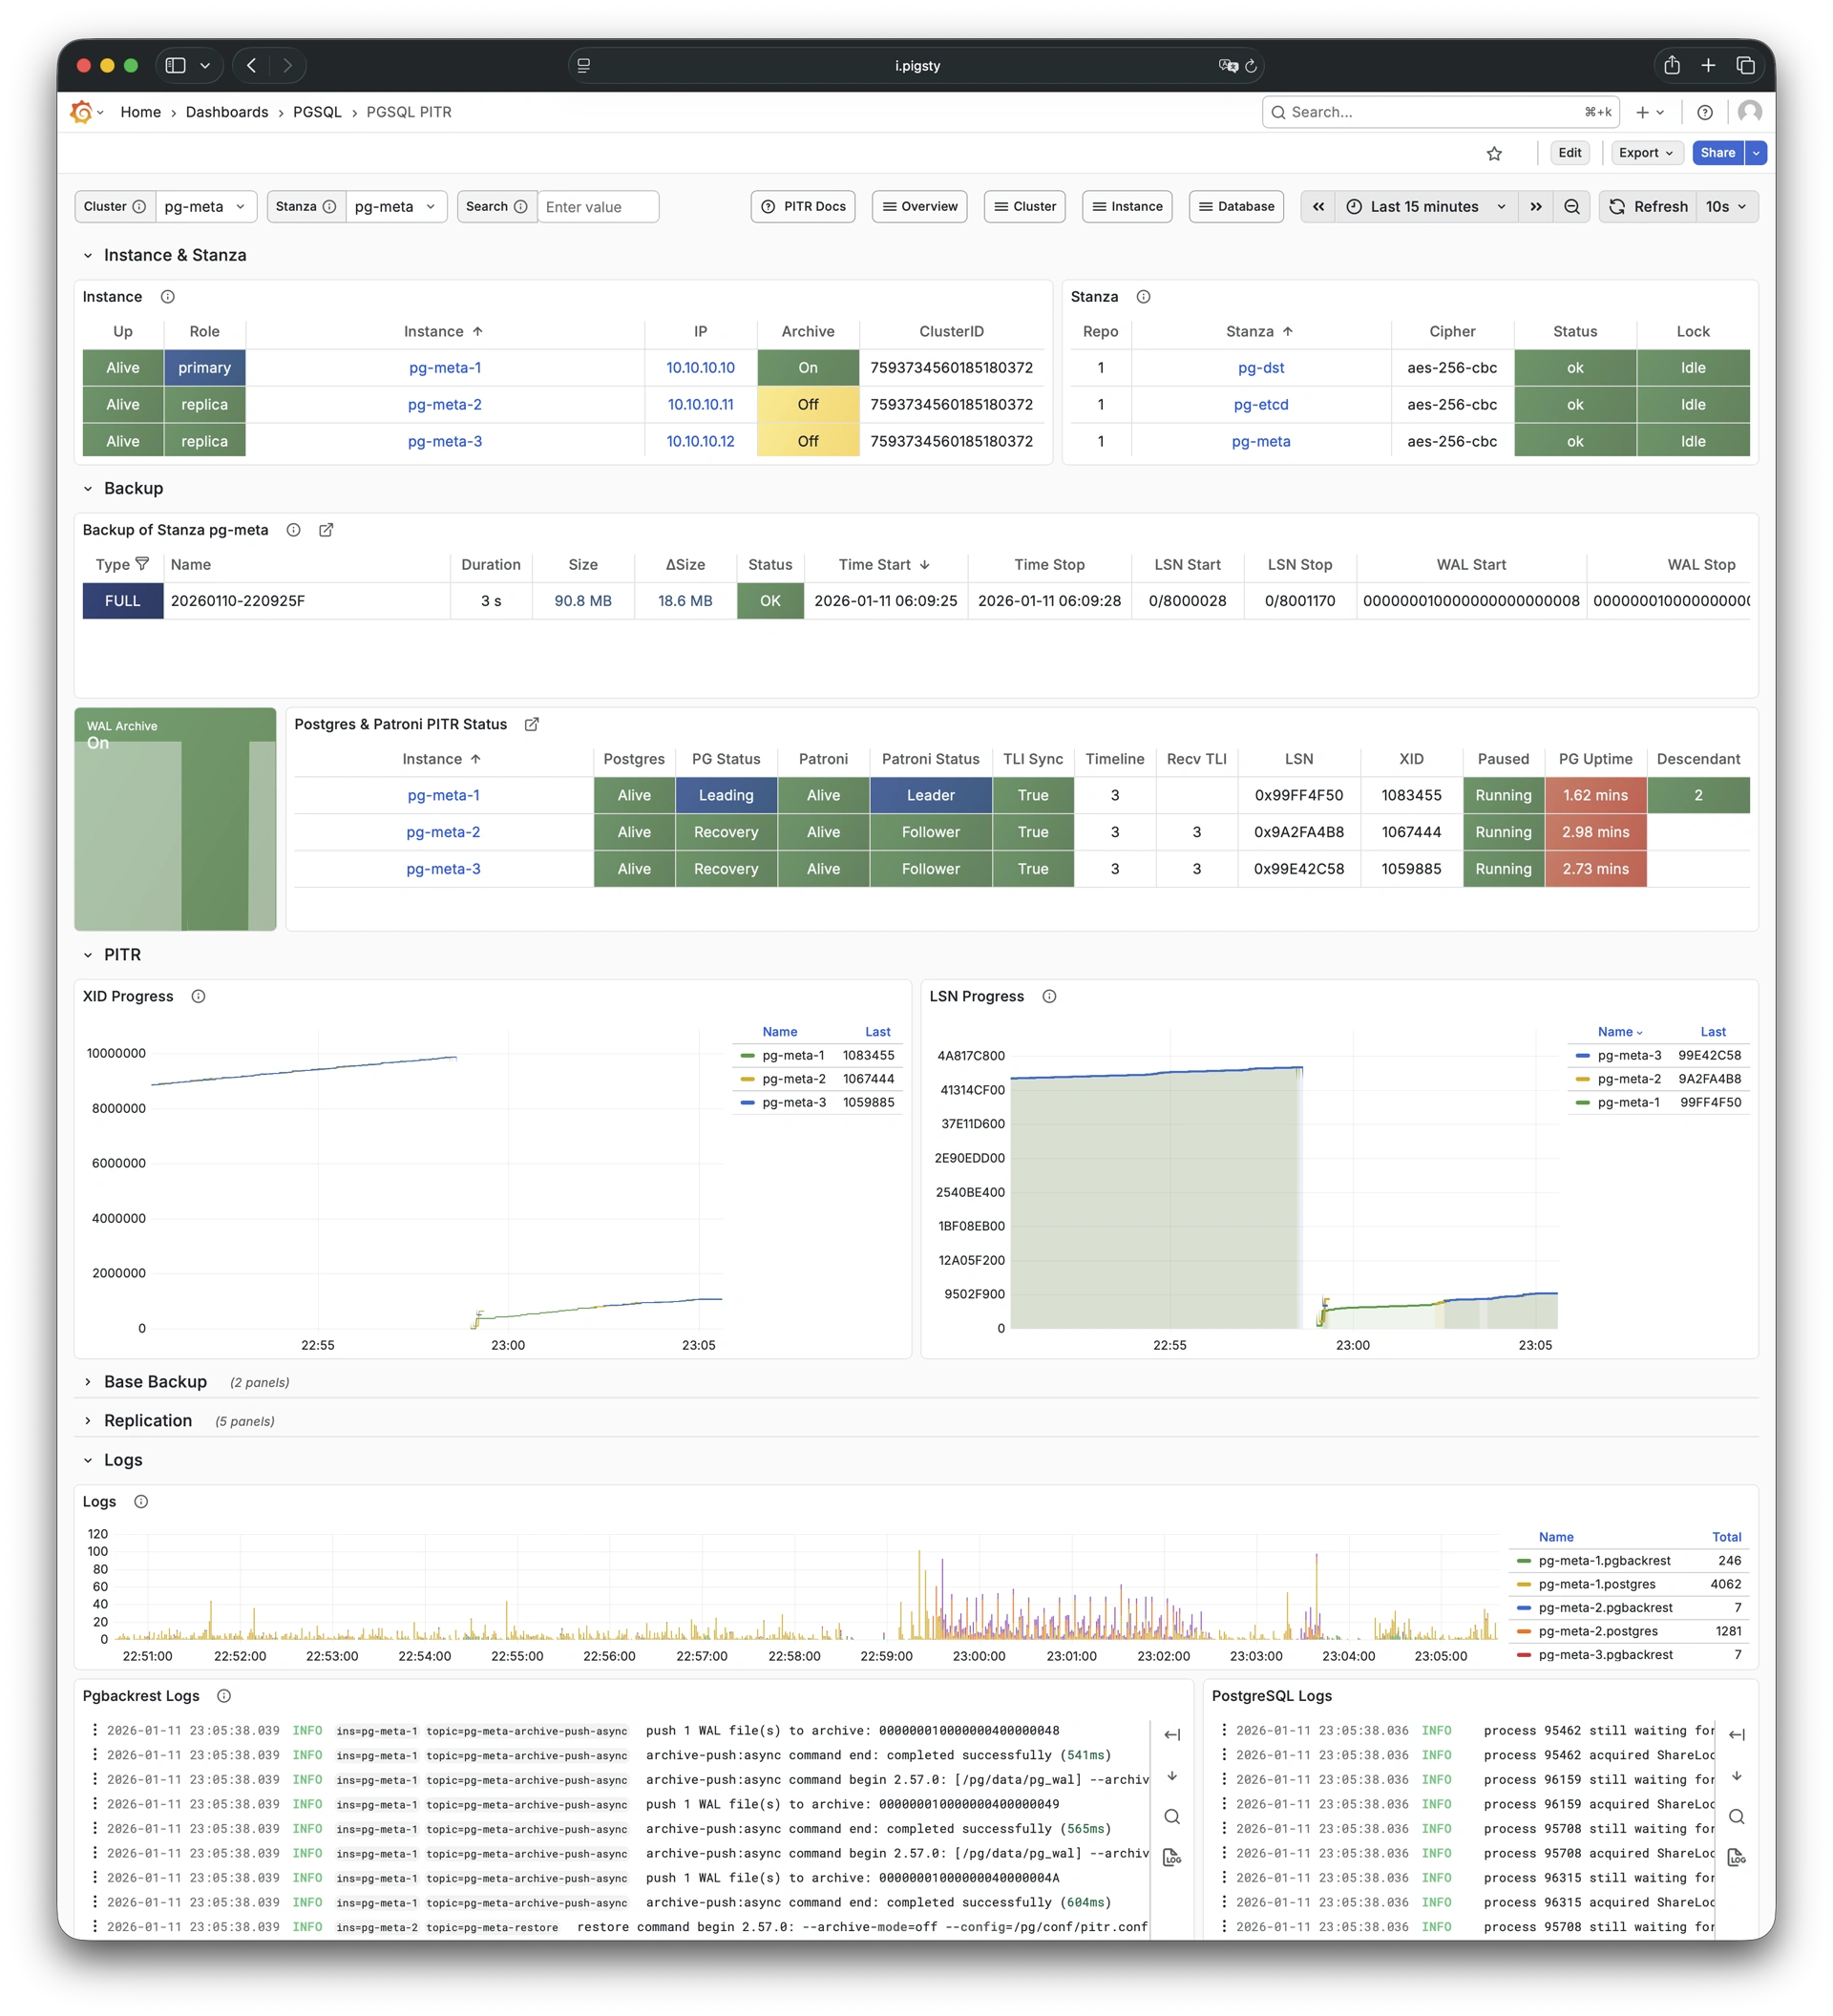
PITR context for point-in-time recovery: Demo
PGSQL PITR provides context information for point-in-time recovery operations, showing backup status and WAL timeline.
3 - Instance
PostgreSQL instance-level monitoring dashboards, including:
- PGSQL Instance: Main dashboard for a single PGSQL instance
- PGRDS Instance: RDS version of PGSQL Instance, focusing on PostgreSQL-native metrics
- PGCAT Instance: Instance info retrieved directly from database catalog
- PGSQL Persist: Persistence metrics: WAL, XID, checkpoint, archive, IO
- PGSQL Proxy: Detailed metrics for a single HAProxy load balancer
- PGSQL Pgbouncer: Metrics overview for a single Pgbouncer connection pooler
- PGSQL Session: Session and active/idle time metrics for a single instance
- PGSQL Xacts: Transaction, lock, TPS/QPS related metrics
- PGSQL Exporter: Self-monitoring metrics for Postgres and Pgbouncer exporters
3.1 - PGSQL Instance
Main dashboard for a single PGSQL instance: Demo
PGSQL Instance is the main dashboard for a single PostgreSQL instance, providing comprehensive instance-level metrics.
3.2 - PGRDS Instance
RDS version of PGSQL Instance: Demo
PGRDS Instance is the RDS version of PGSQL Instance, focusing on PostgreSQL-native metrics without host-level metrics.
3.3 - PGCAT Instance
Instance info from database catalog: Demo
PGCAT Instance shows instance-level information retrieved directly from PostgreSQL system catalog.
3.4 - PGSQL Persist
Persistence metrics for PGSQL instance: Demo
PGSQL Persist focuses on persistence-related metrics: WAL generation, XID consumption, checkpoints, archiving, and I/O patterns.
3.5 - PGSQL Proxy
Detailed metrics for HAProxy: Demo
PGSQL Proxy shows detailed metrics for a single HAProxy load balancer instance serving PostgreSQL traffic.
3.6 - PGSQL Pgbouncer
Metrics overview for Pgbouncer: Demo
PGSQL Pgbouncer shows connection pooling metrics for a single Pgbouncer instance.
3.7 - PGSQL Session
Session and active/idle time metrics: Demo
PGSQL Session focuses on session statistics and active/idle time distribution for a single PostgreSQL instance.
3.8 - PGSQL Xacts
Transaction, lock, TPS/QPS metrics: Demo
PGSQL Xacts focuses on transaction processing, lock activity, and TPS/QPS metrics for a single PostgreSQL instance.
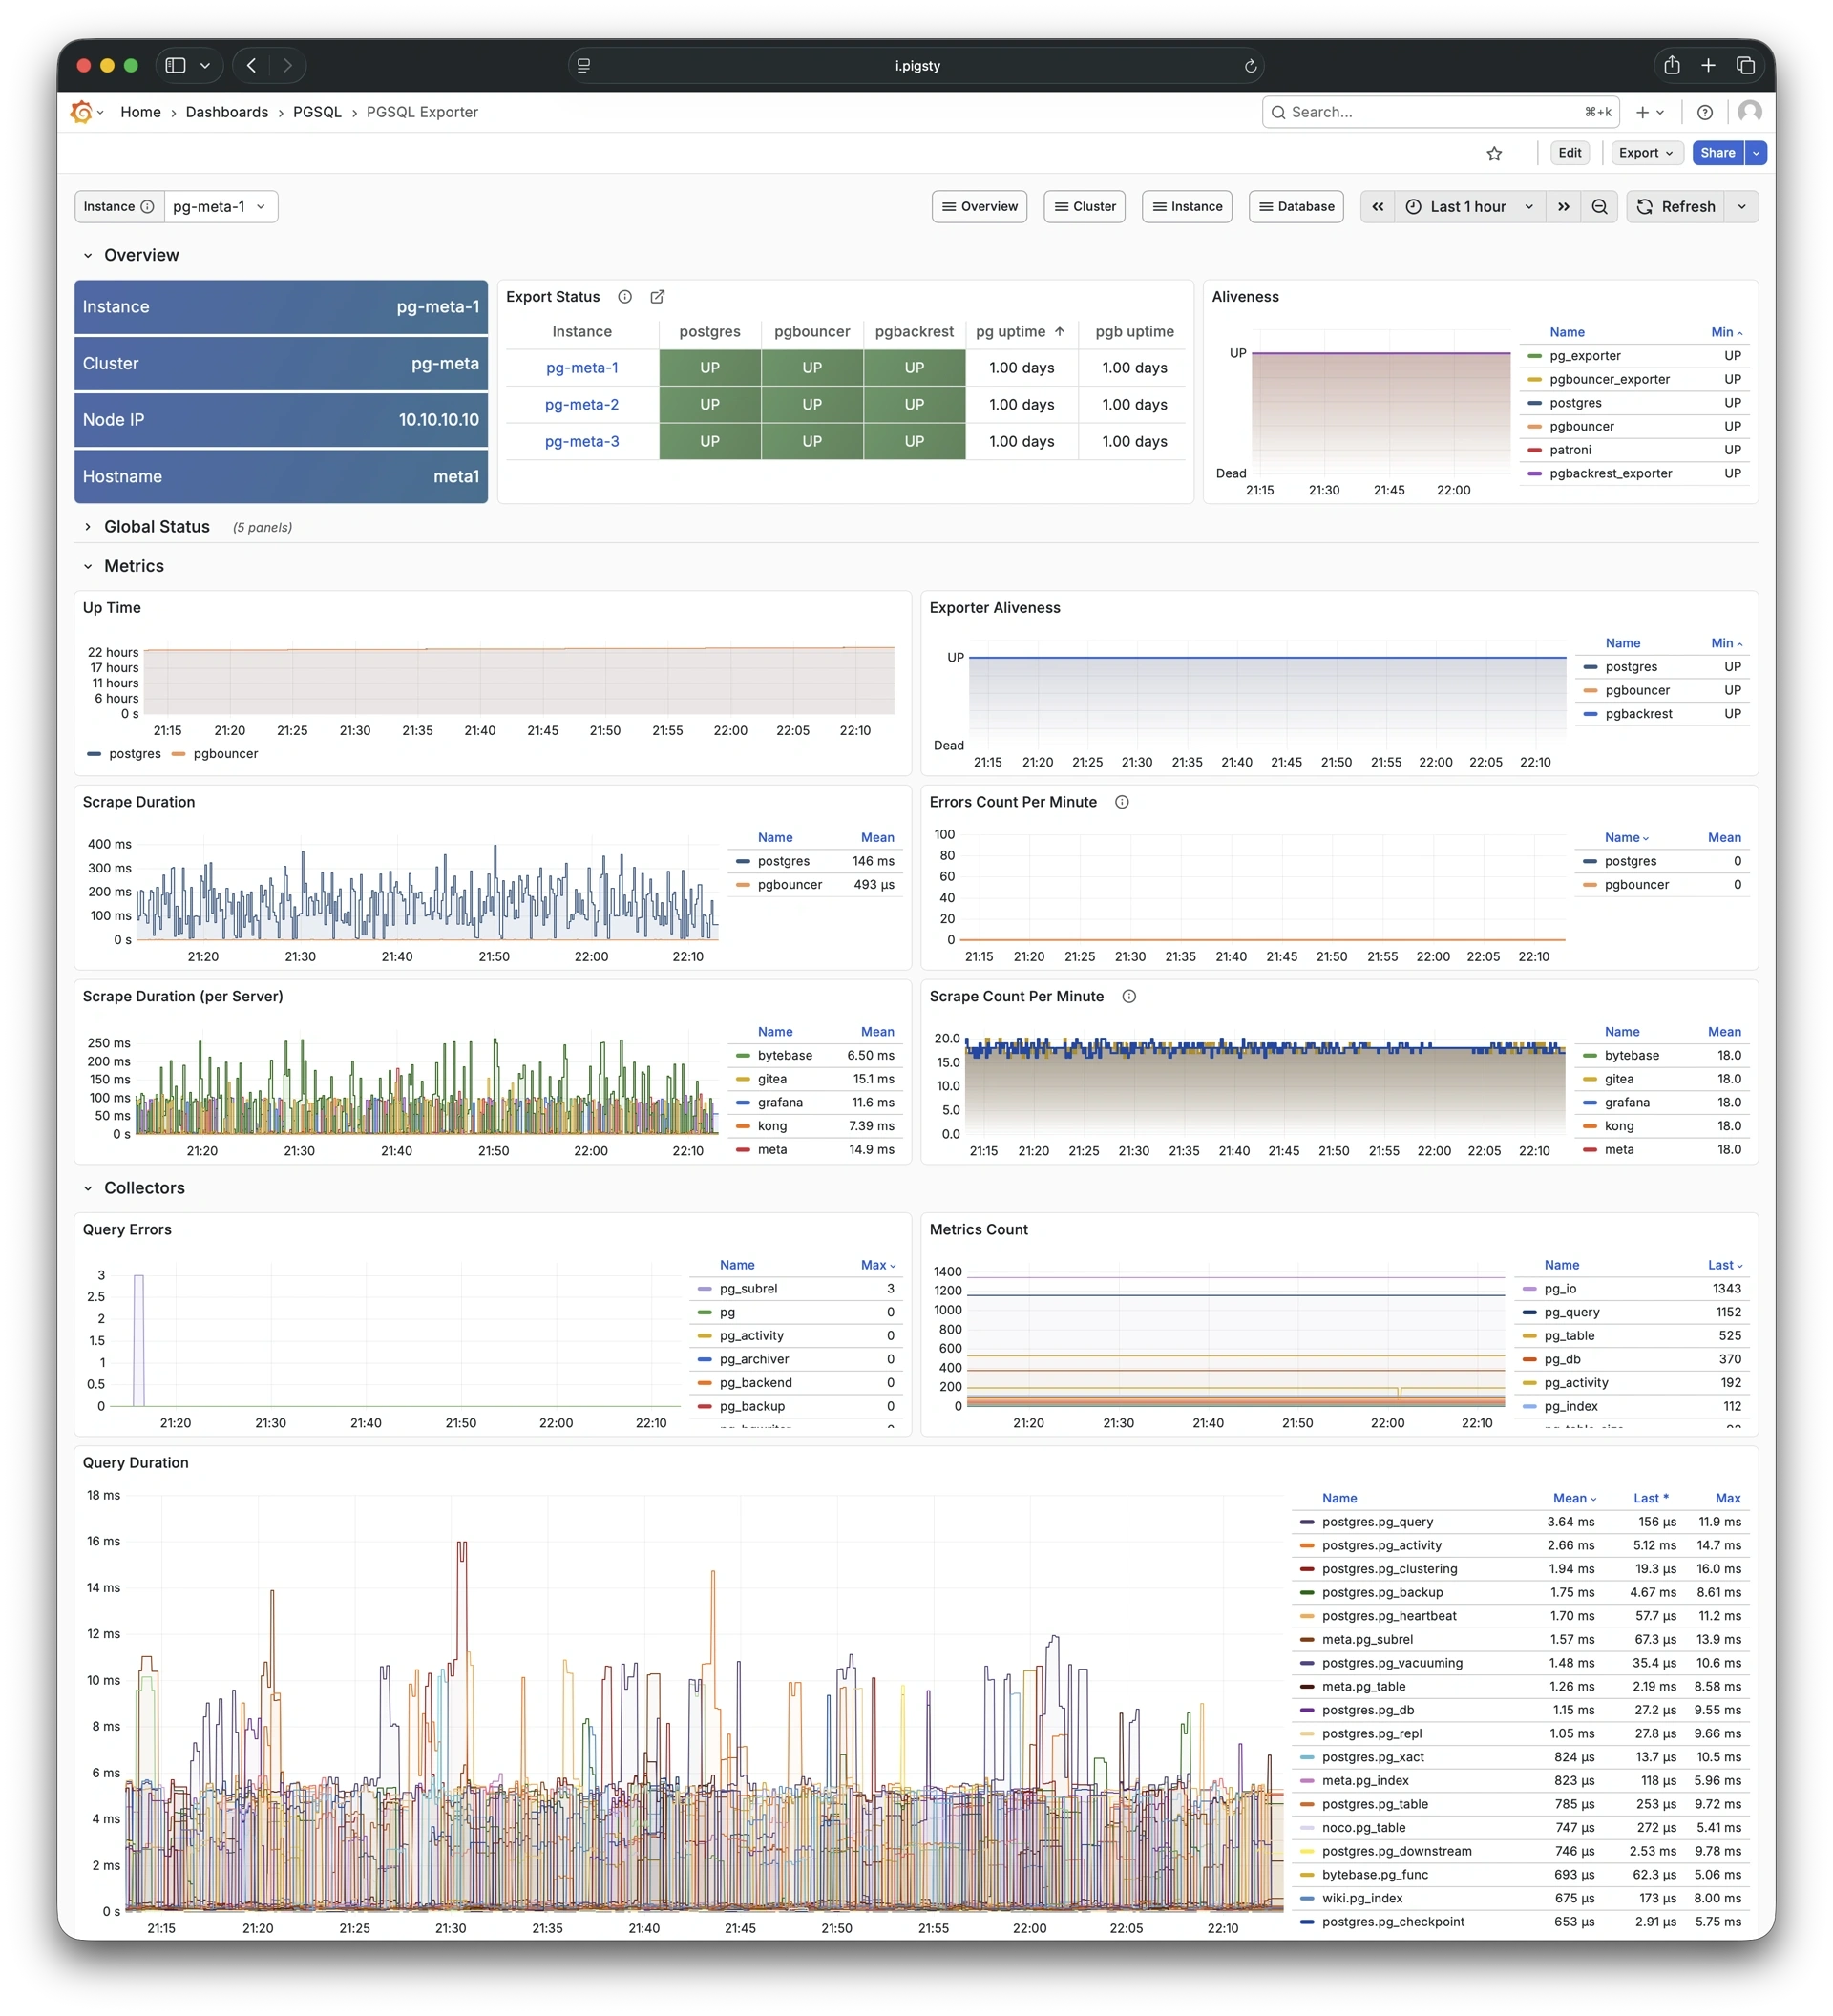
3.9 - PGSQL Exporter
Self-monitoring metrics for exporters: Demo
PGSQL Exporter shows self-monitoring metrics for the Postgres exporter and Pgbouncer exporter components.
4 - Database
PostgreSQL database-level monitoring dashboards, including:
- PGSQL Database: Main dashboard for a single PGSQL database
- PGCAT Database: Database info retrieved directly from database catalog
- PGSQL Tables: Table/index access metrics within a single database
- PGSQL Table: Detailed info for a single table (QPS/RT/index/sequence…)
- PGCAT Table: Detailed table info from database catalog
- PGSQL Query: Detailed info for a query type (QPS/RT)
- PGCAT Query: Query details from database catalog
- PGCAT Locks: Activity and lock wait info from database catalog
- PGCAT Schema: Schema info from database catalog
4.1 - PGSQL Database
Main dashboard for a single PGSQL database: Demo
PGSQL Database is the main dashboard for a single PostgreSQL database, providing comprehensive database-level metrics.
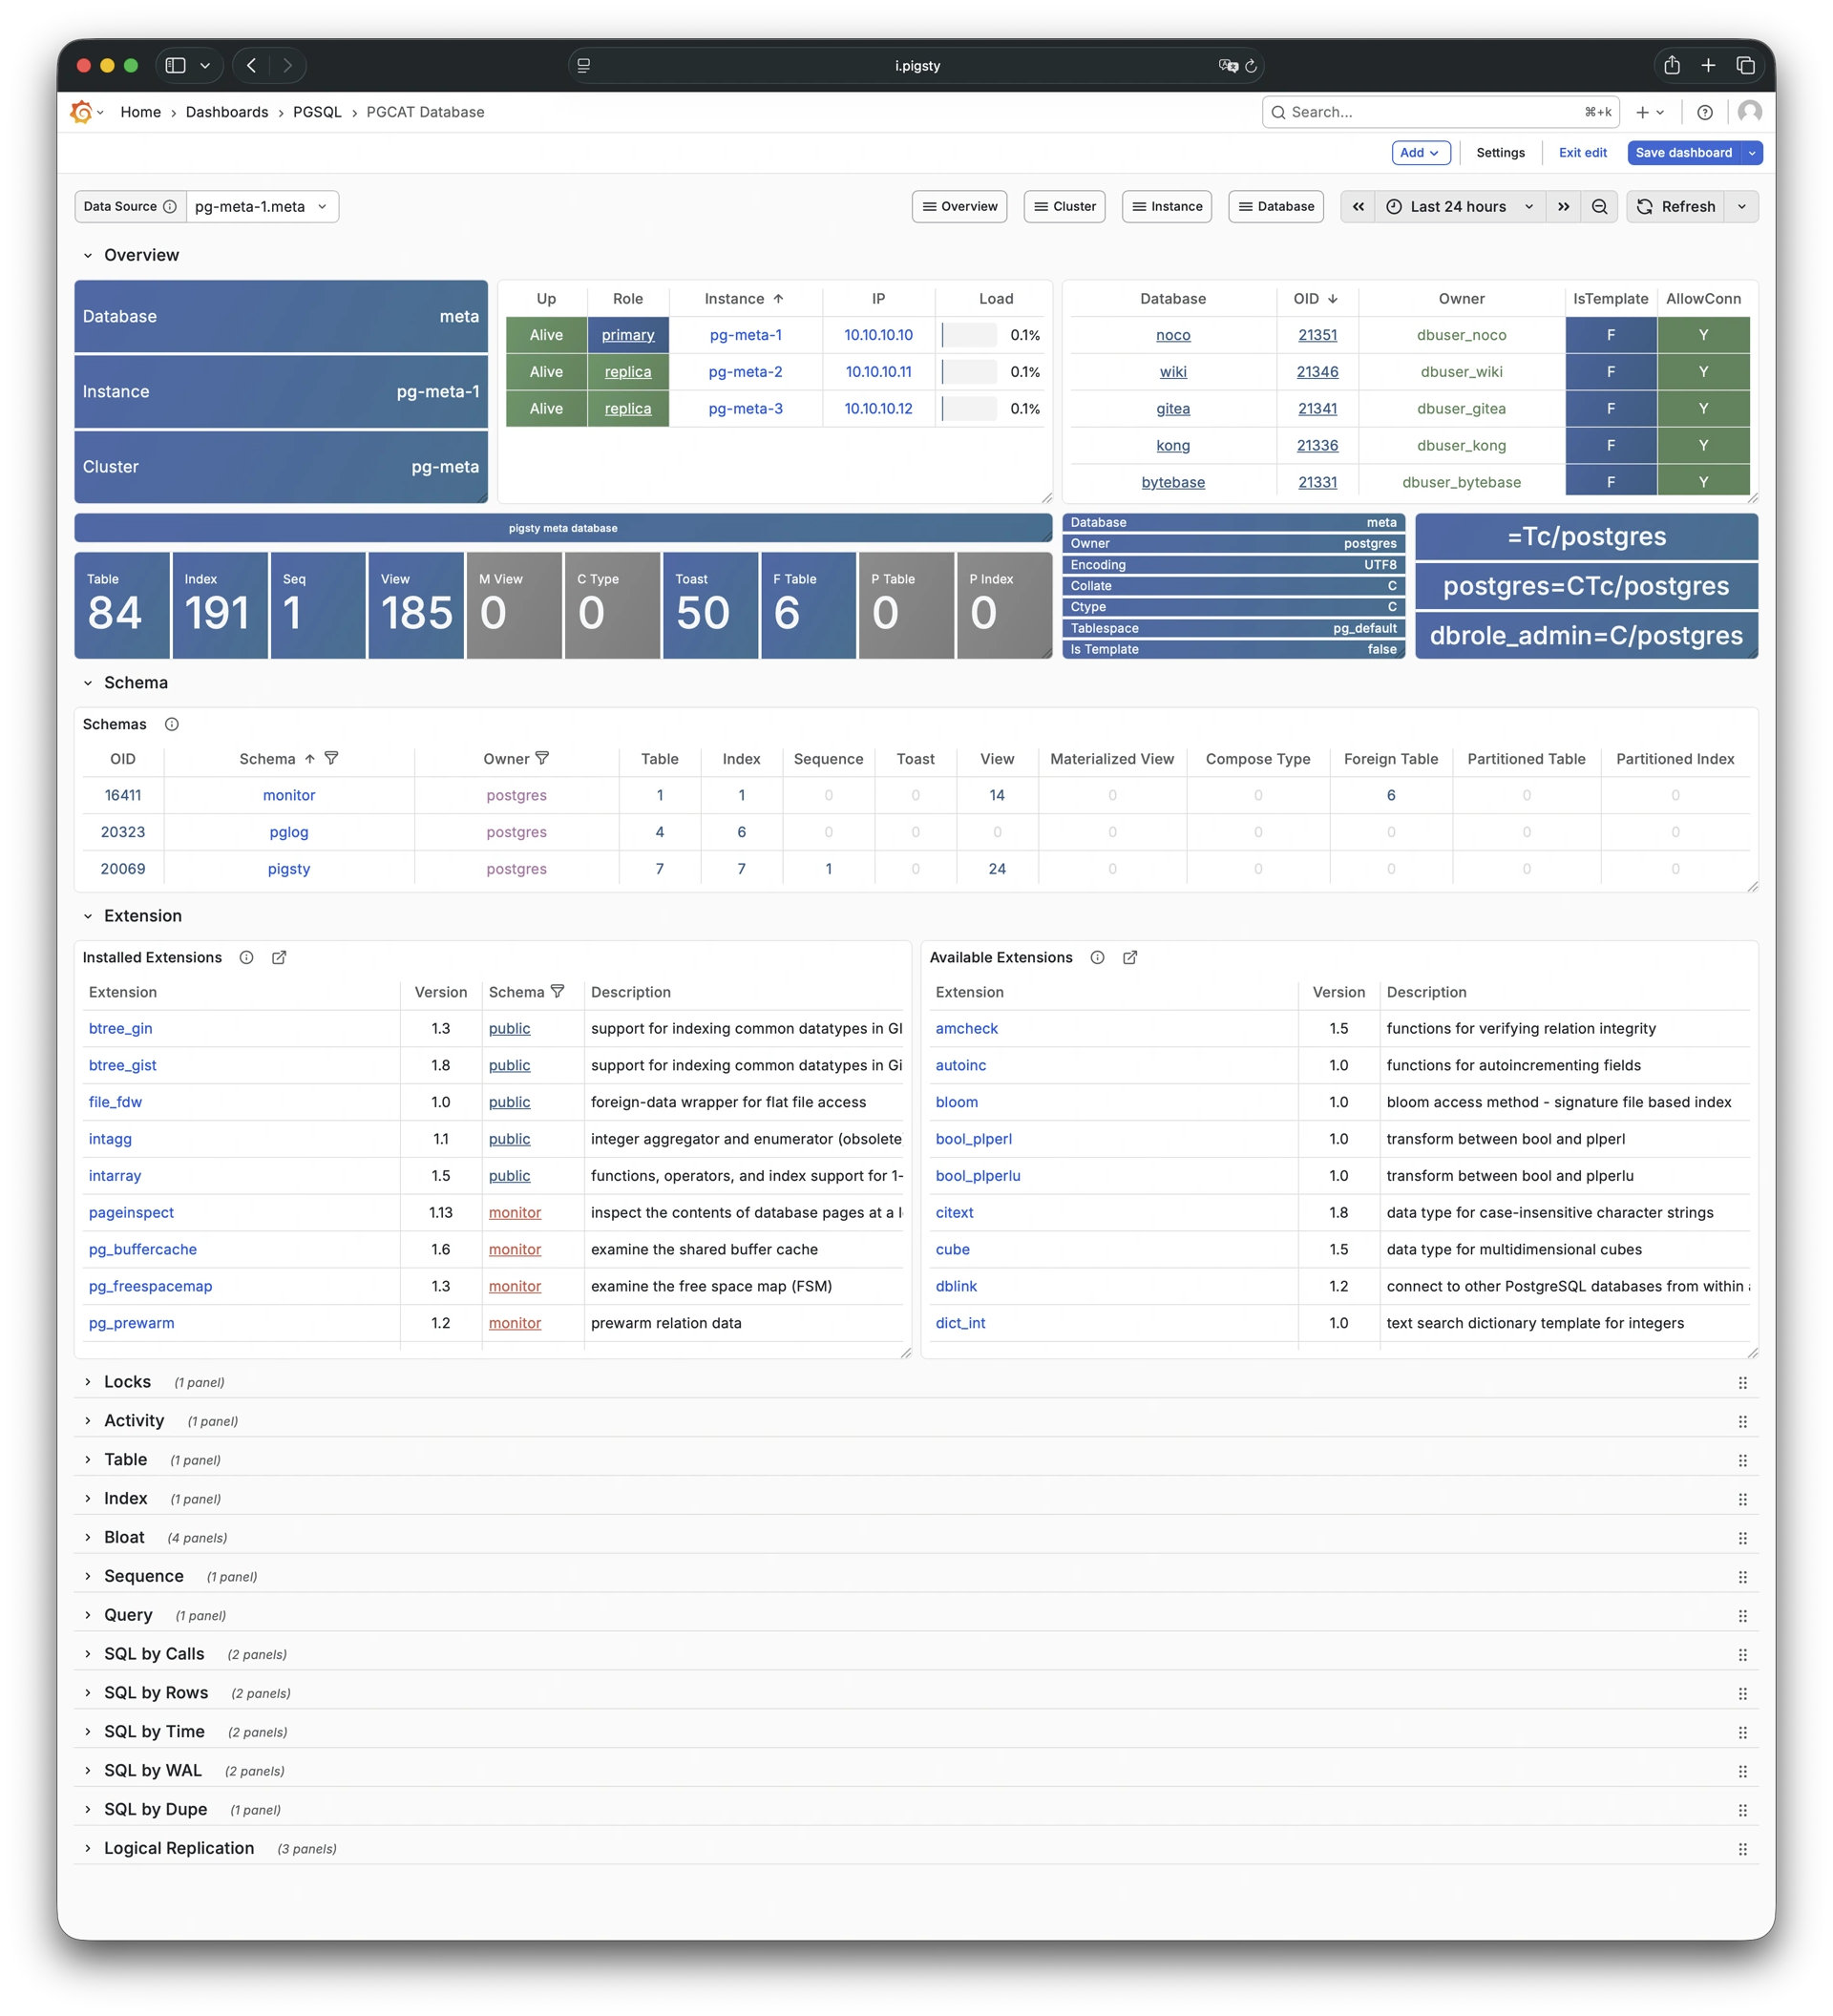
4.2 - PGCAT Database
Database info from database catalog: Demo
PGCAT Database shows database-level information retrieved directly from PostgreSQL system catalog.
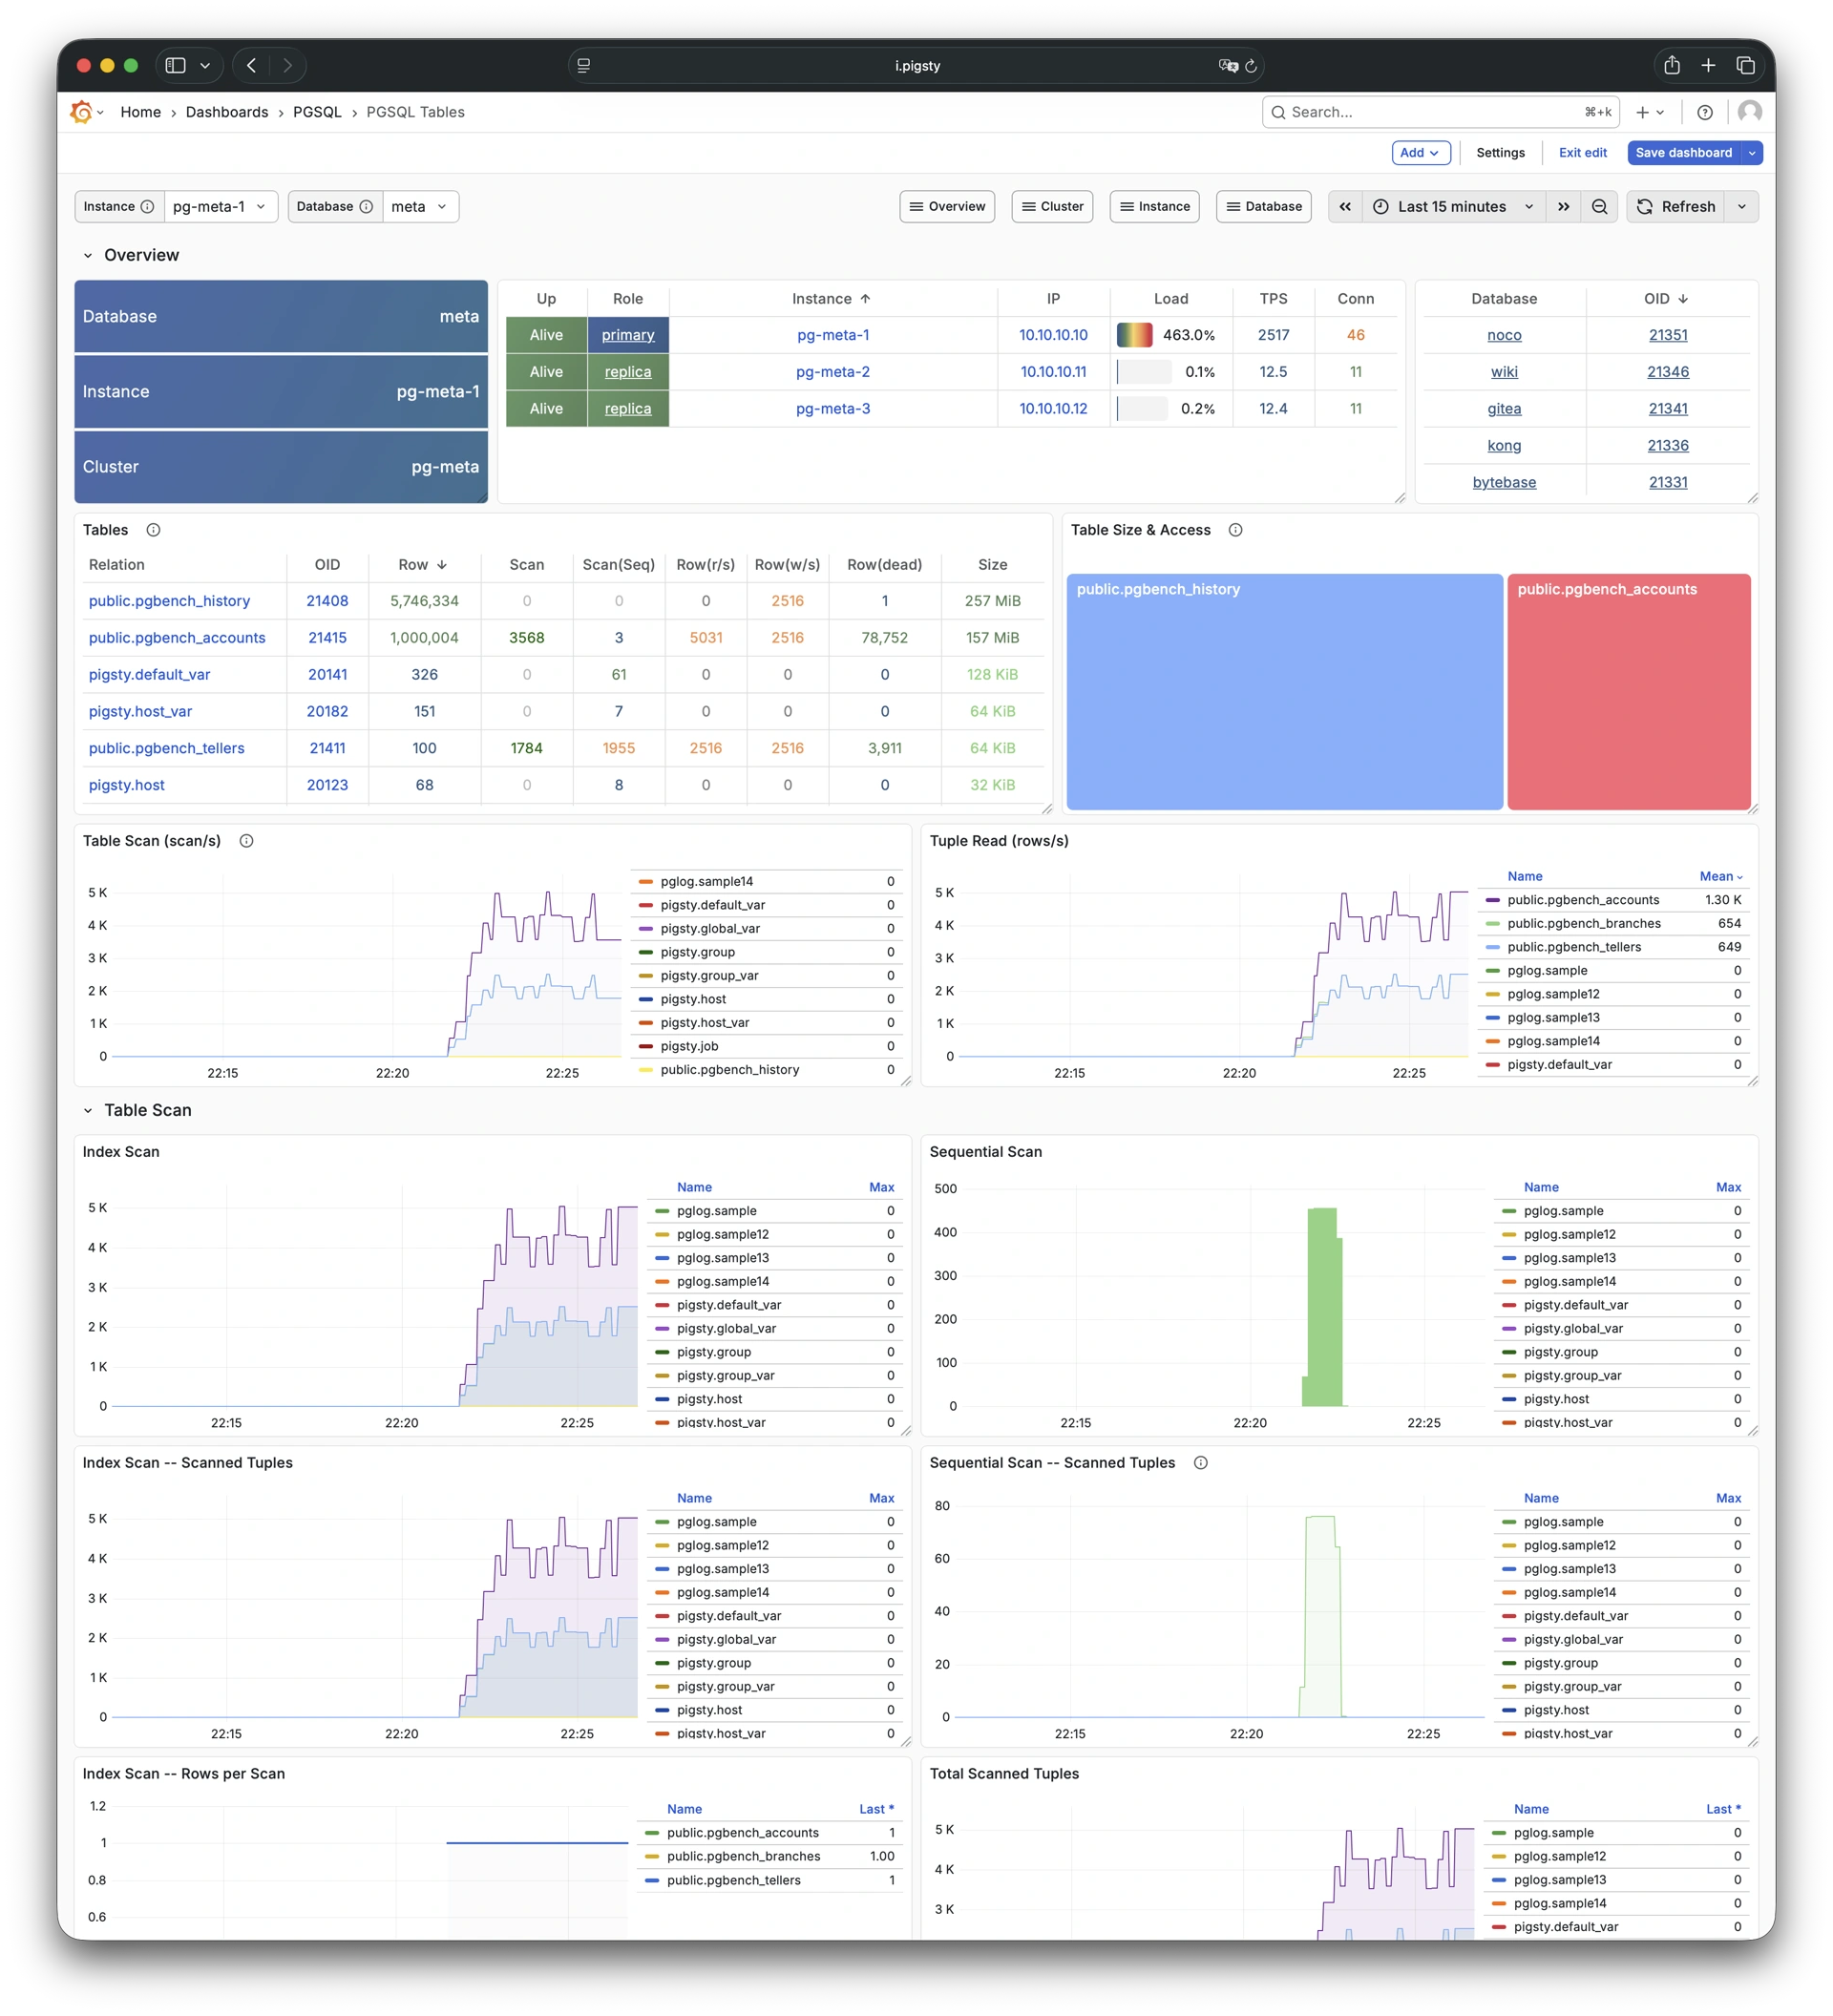
4.3 - PGSQL Tables
Table/index access metrics: Demo
PGSQL Tables shows table and index access metrics for all objects within a single PostgreSQL database.
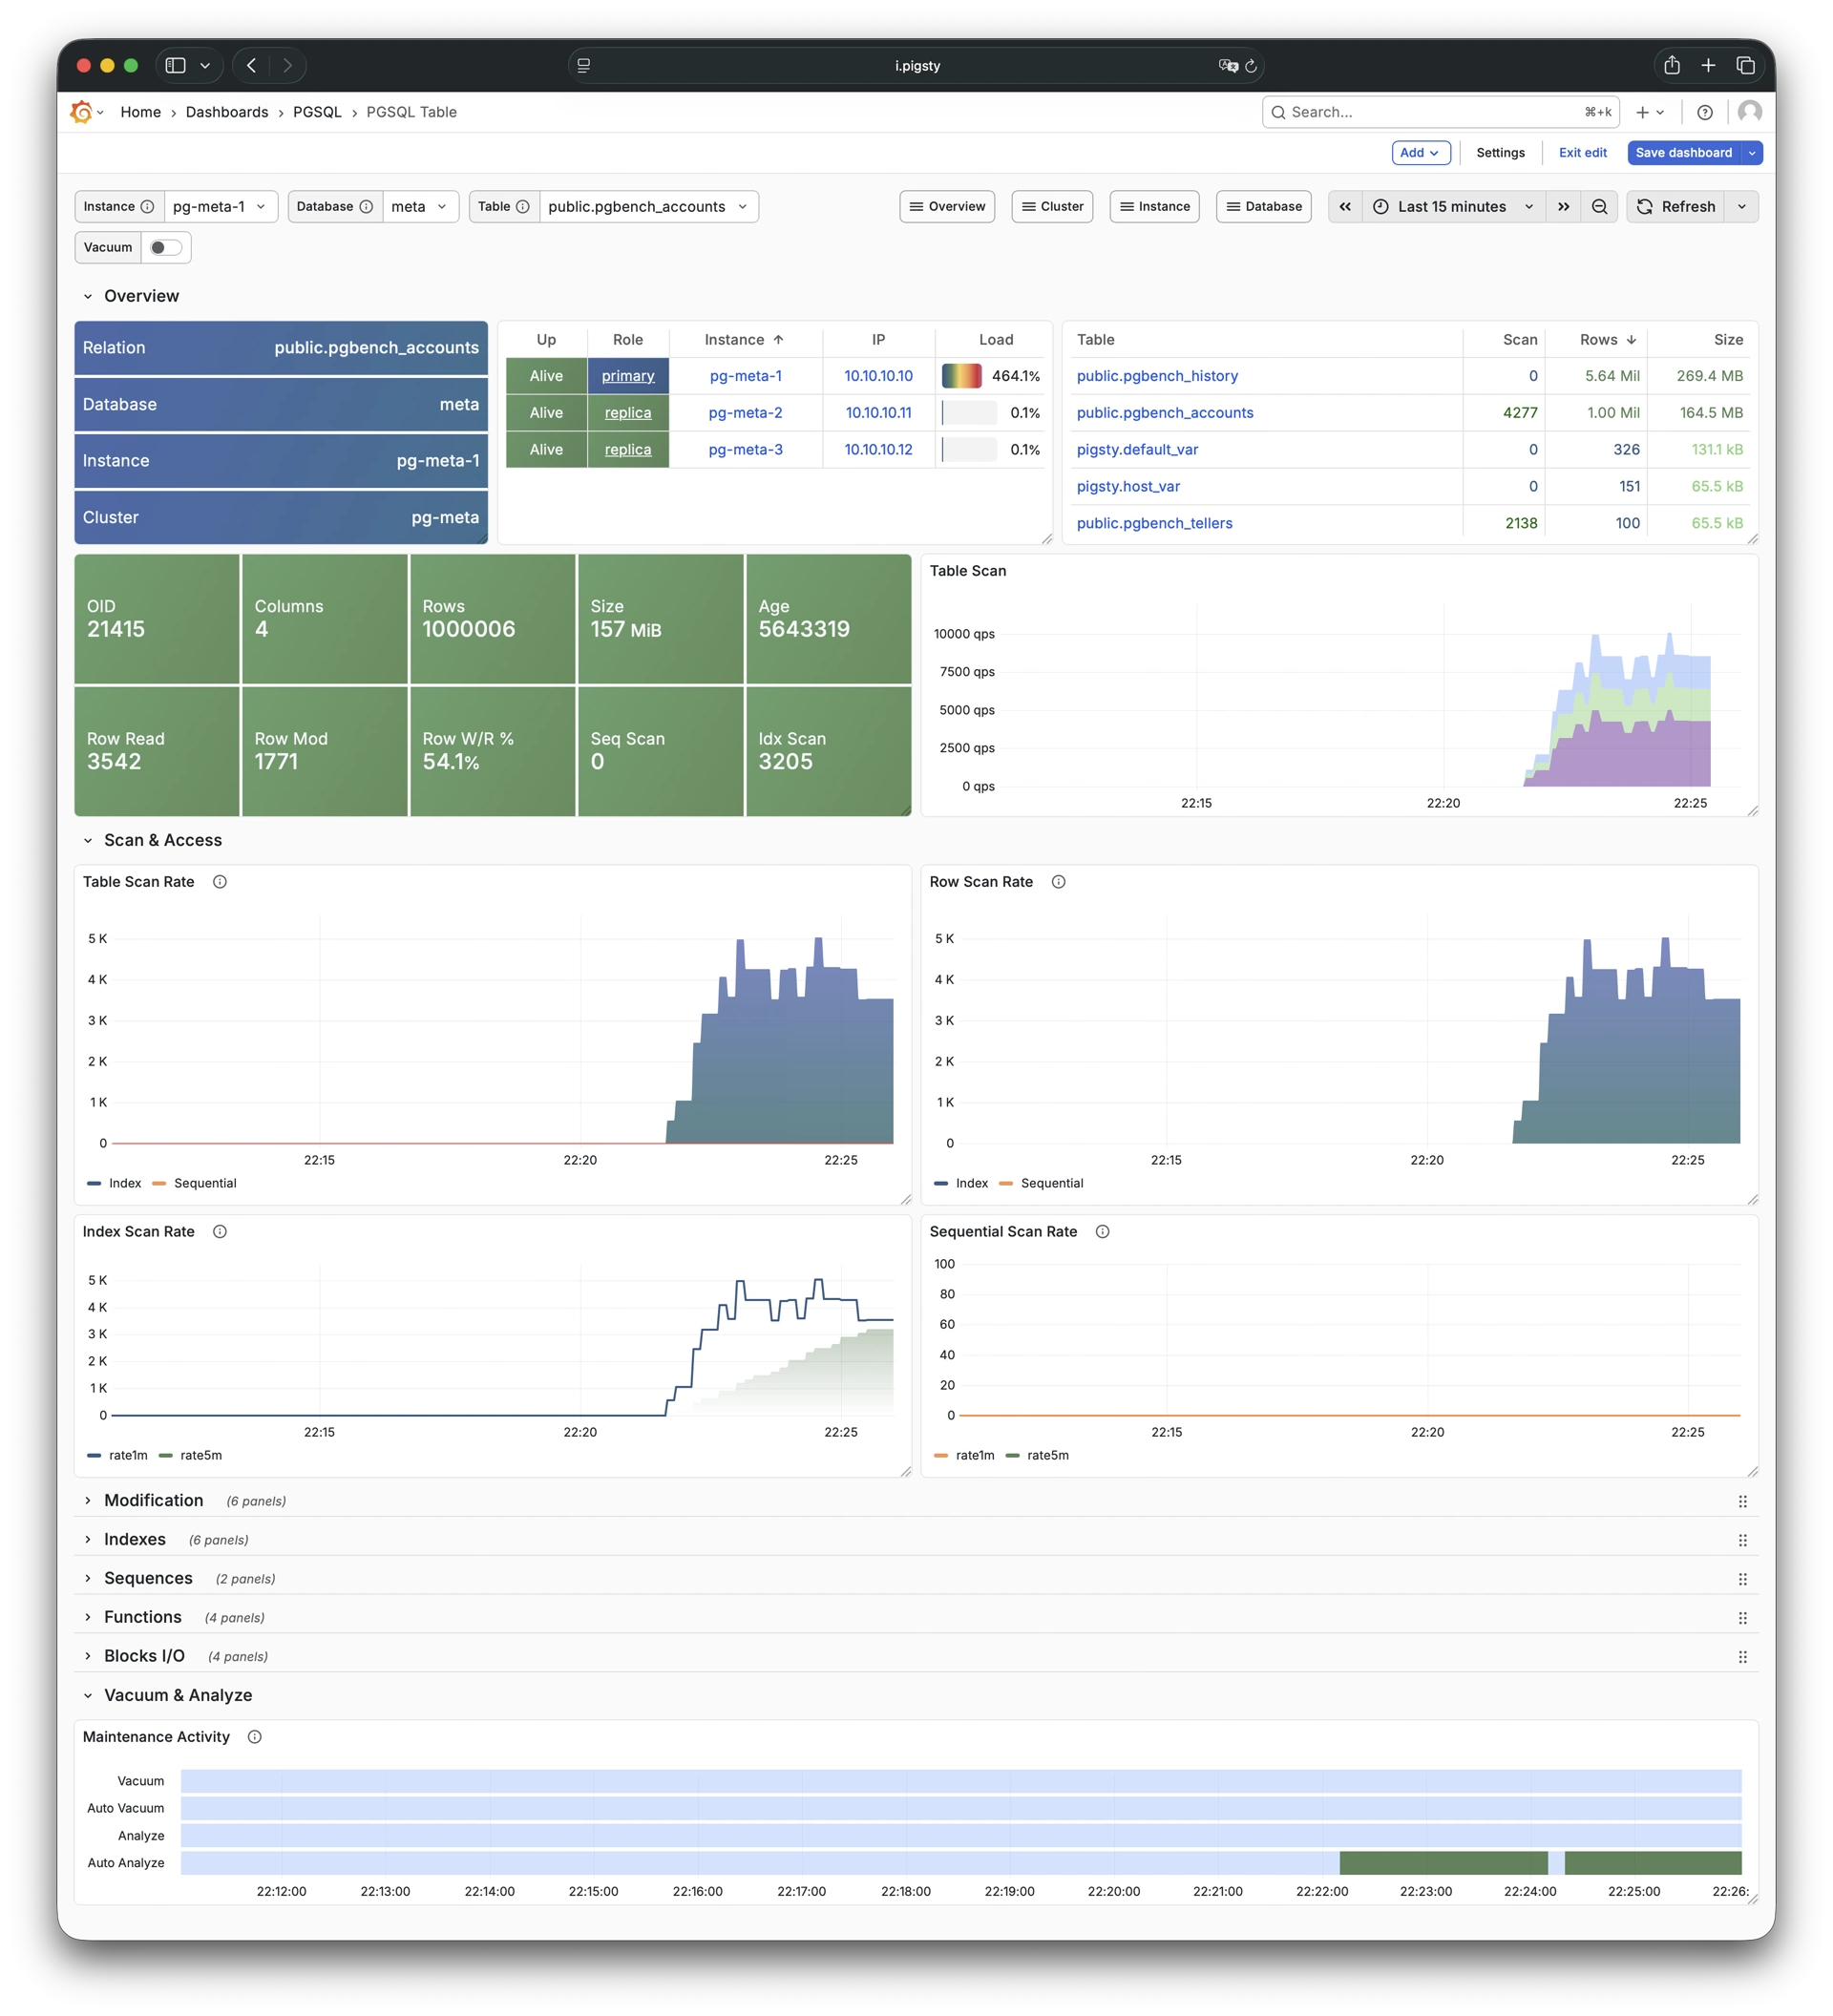
4.4 - PGSQL Table
Detailed info for a single table: Demo
PGSQL Table shows detailed metrics for a single table including QPS, response time, index usage, and sequence info.
4.5 - PGCAT Table
Detailed table info from catalog: Demo
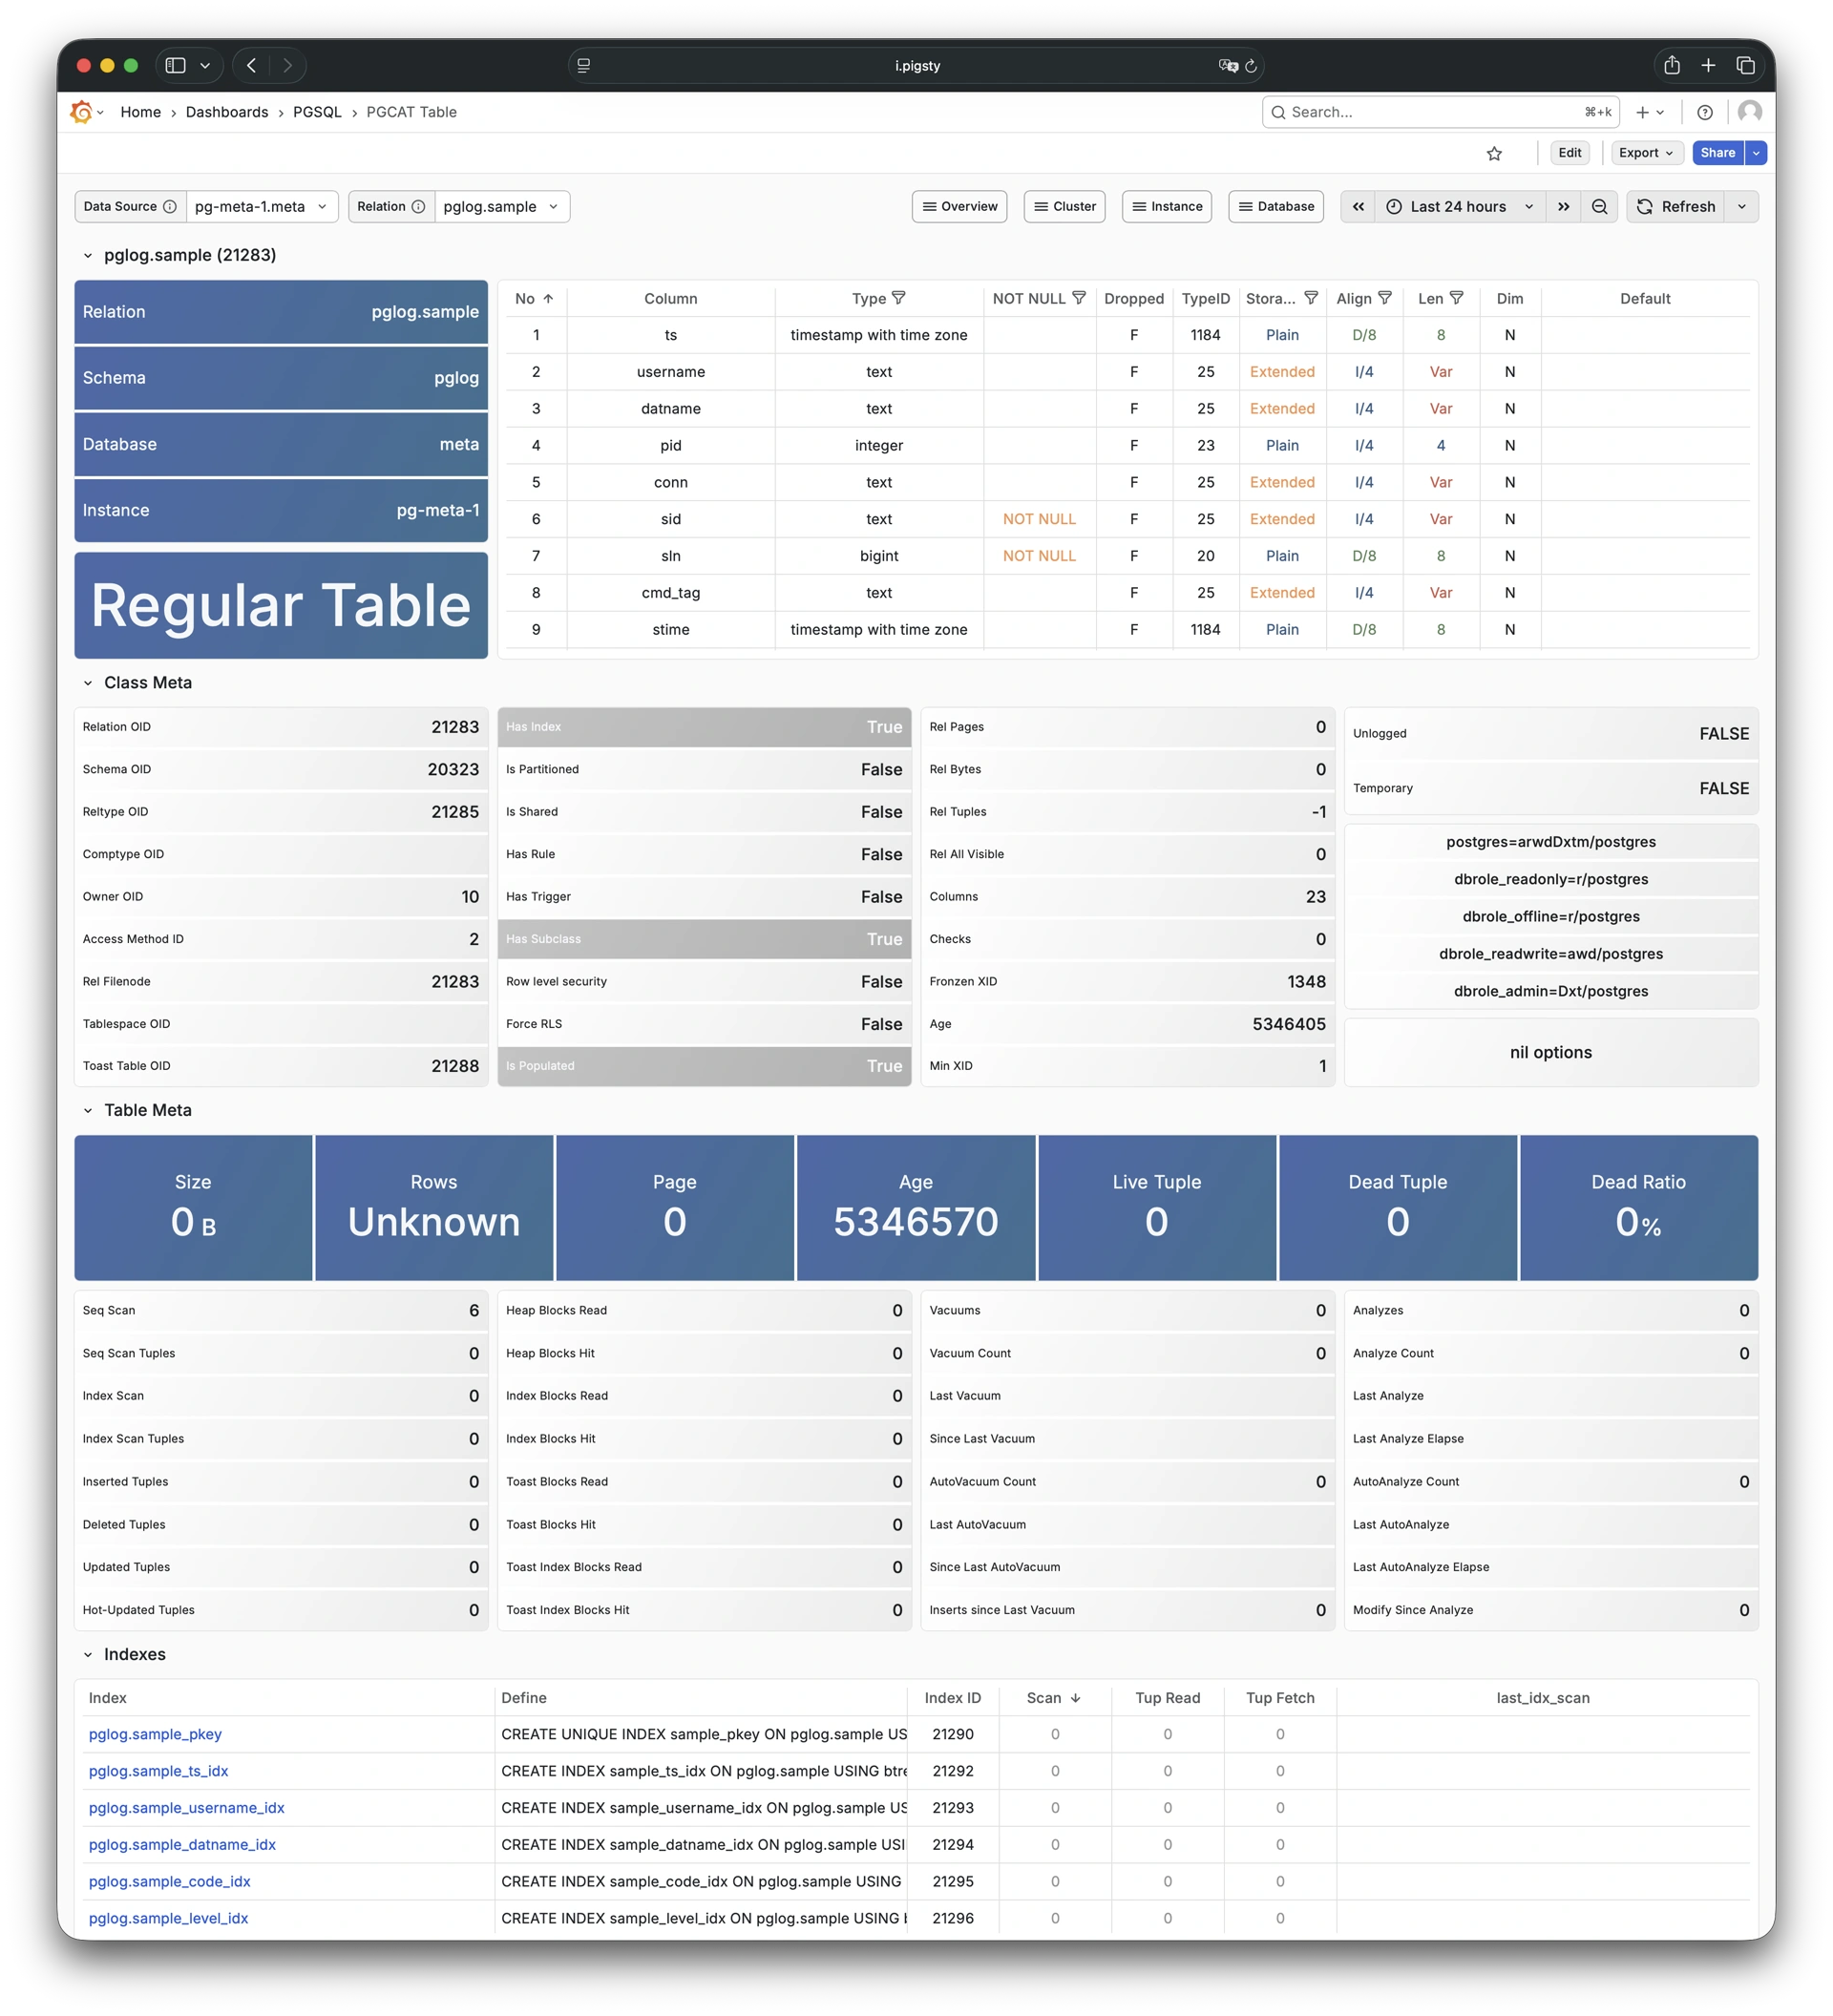
PGCAT Table shows detailed table information from database catalog including statistics and bloat analysis.
4.6 - PGSQL Query
Detailed info for a query type: Demo
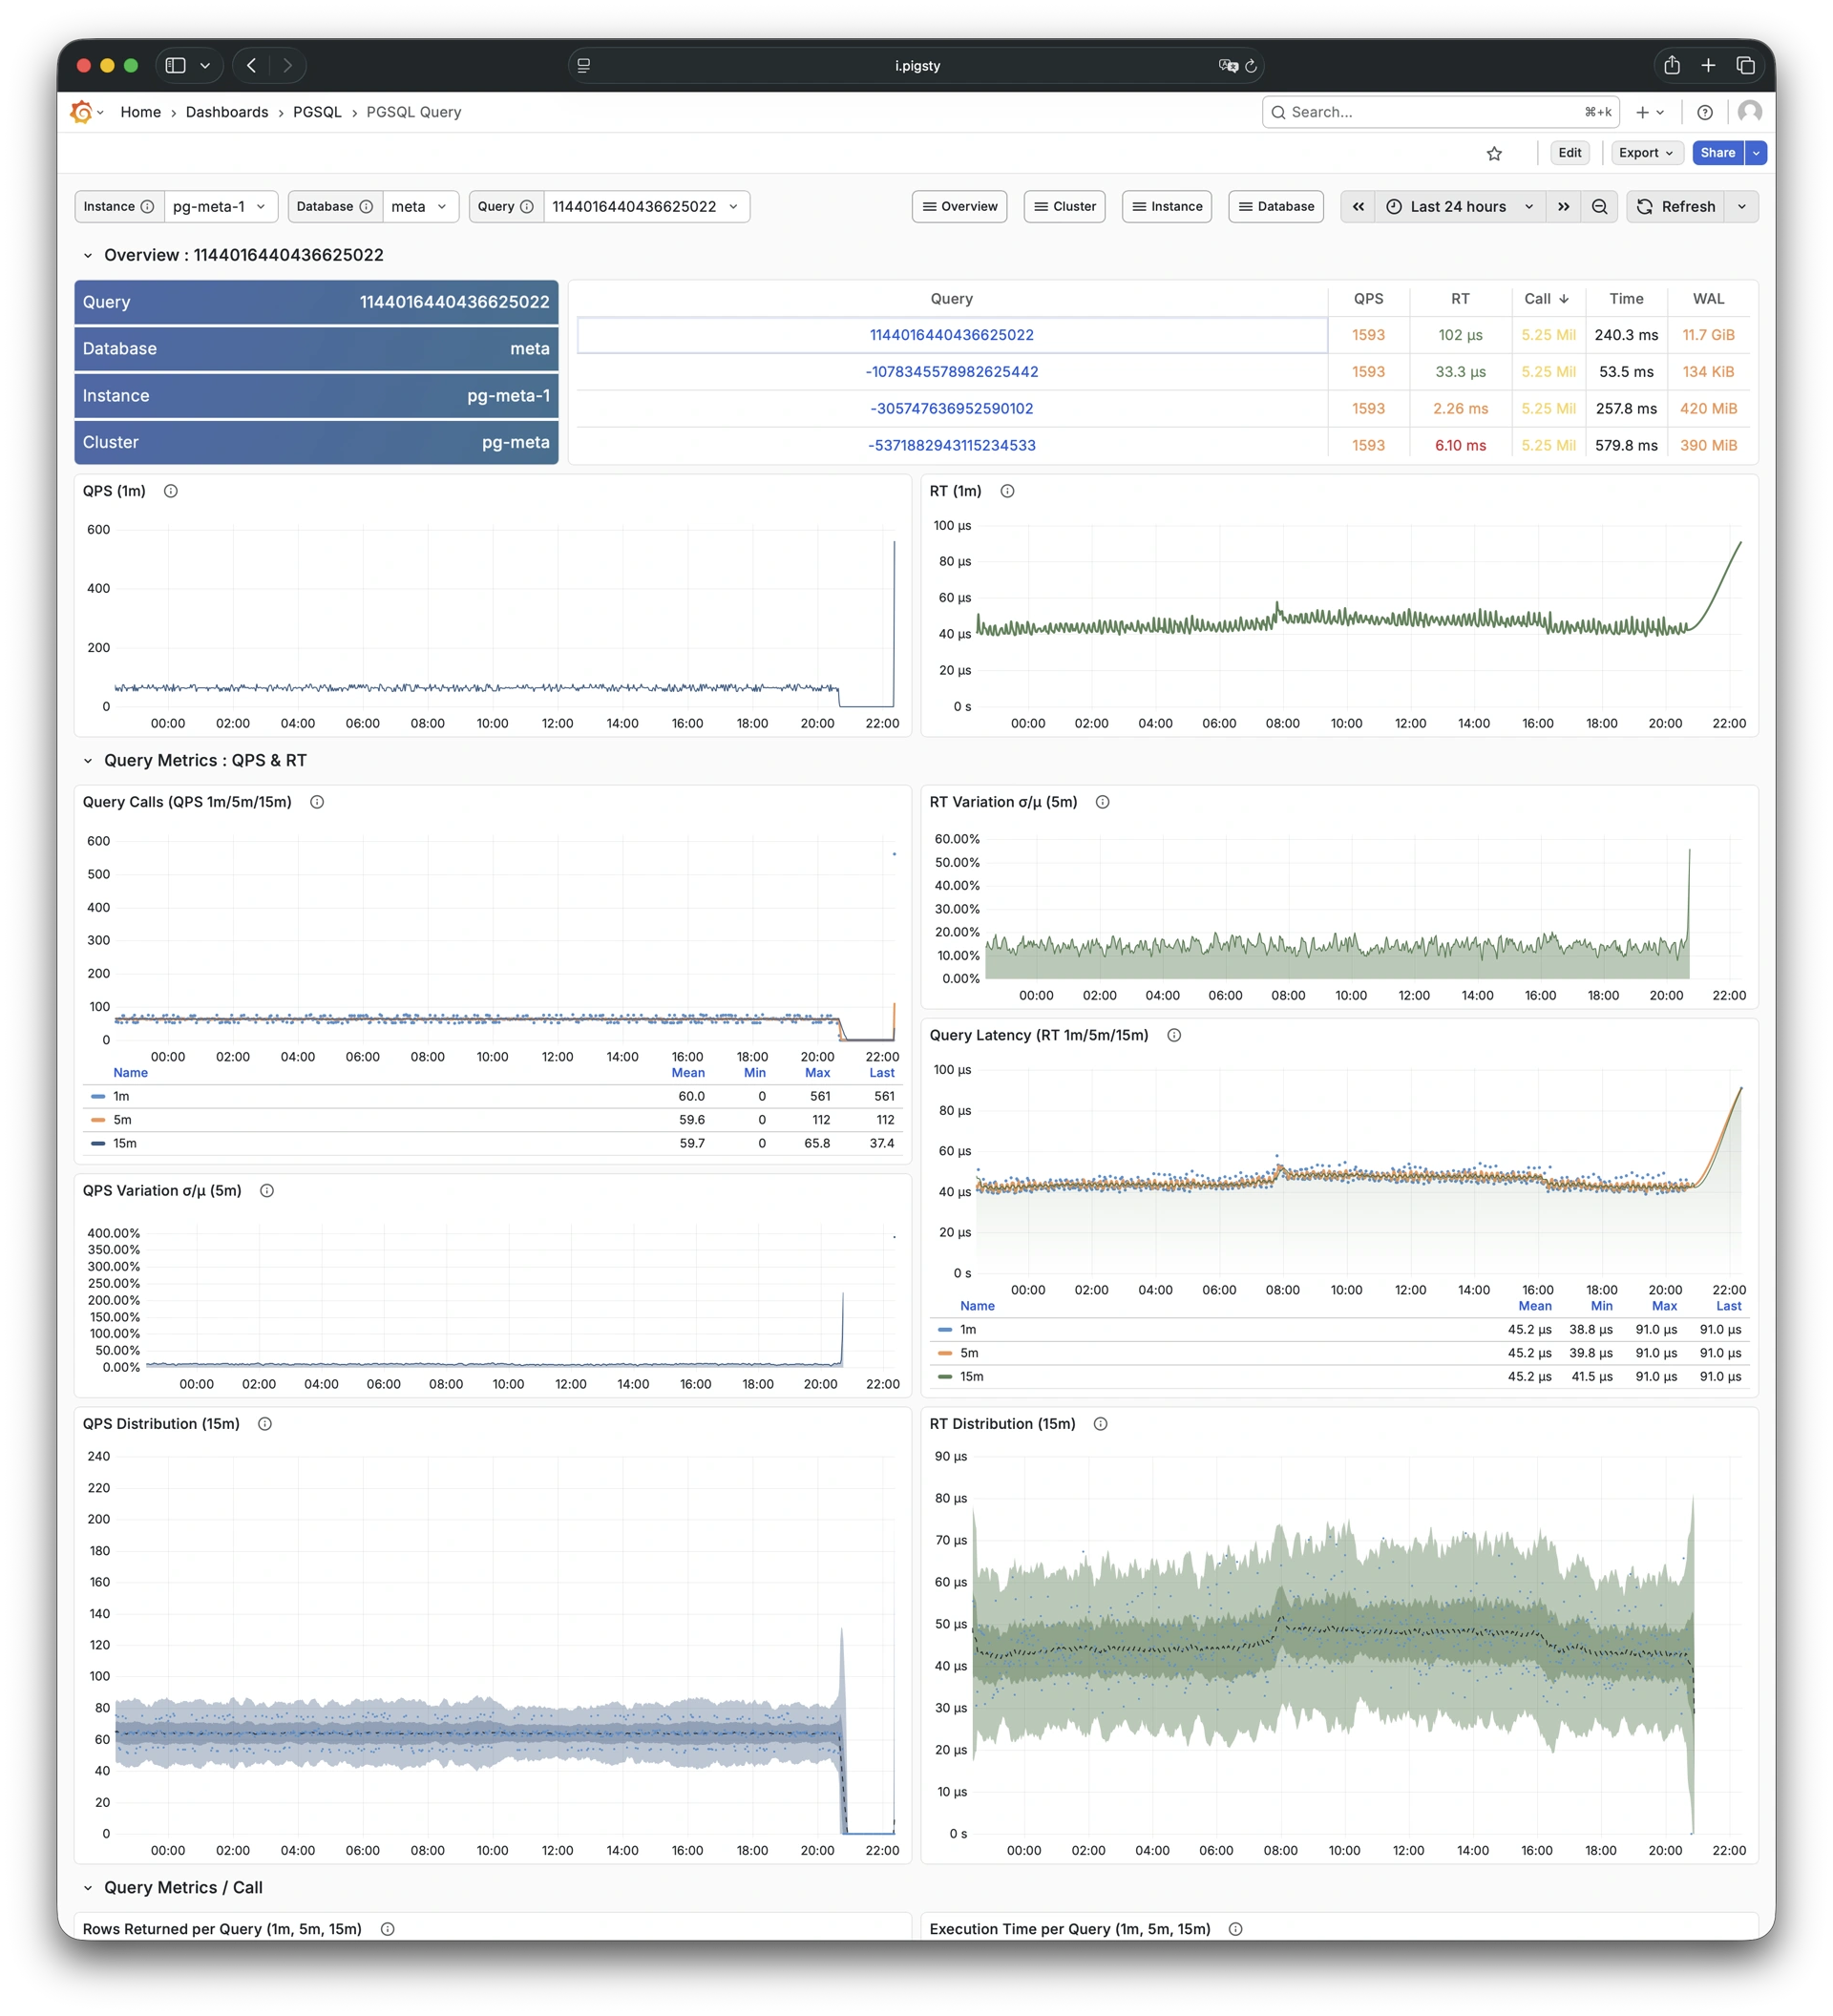
PGSQL Query shows detailed metrics for a specific query type including QPS and response time distribution.
4.7 - PGCAT Query
Query details from database catalog: Demo
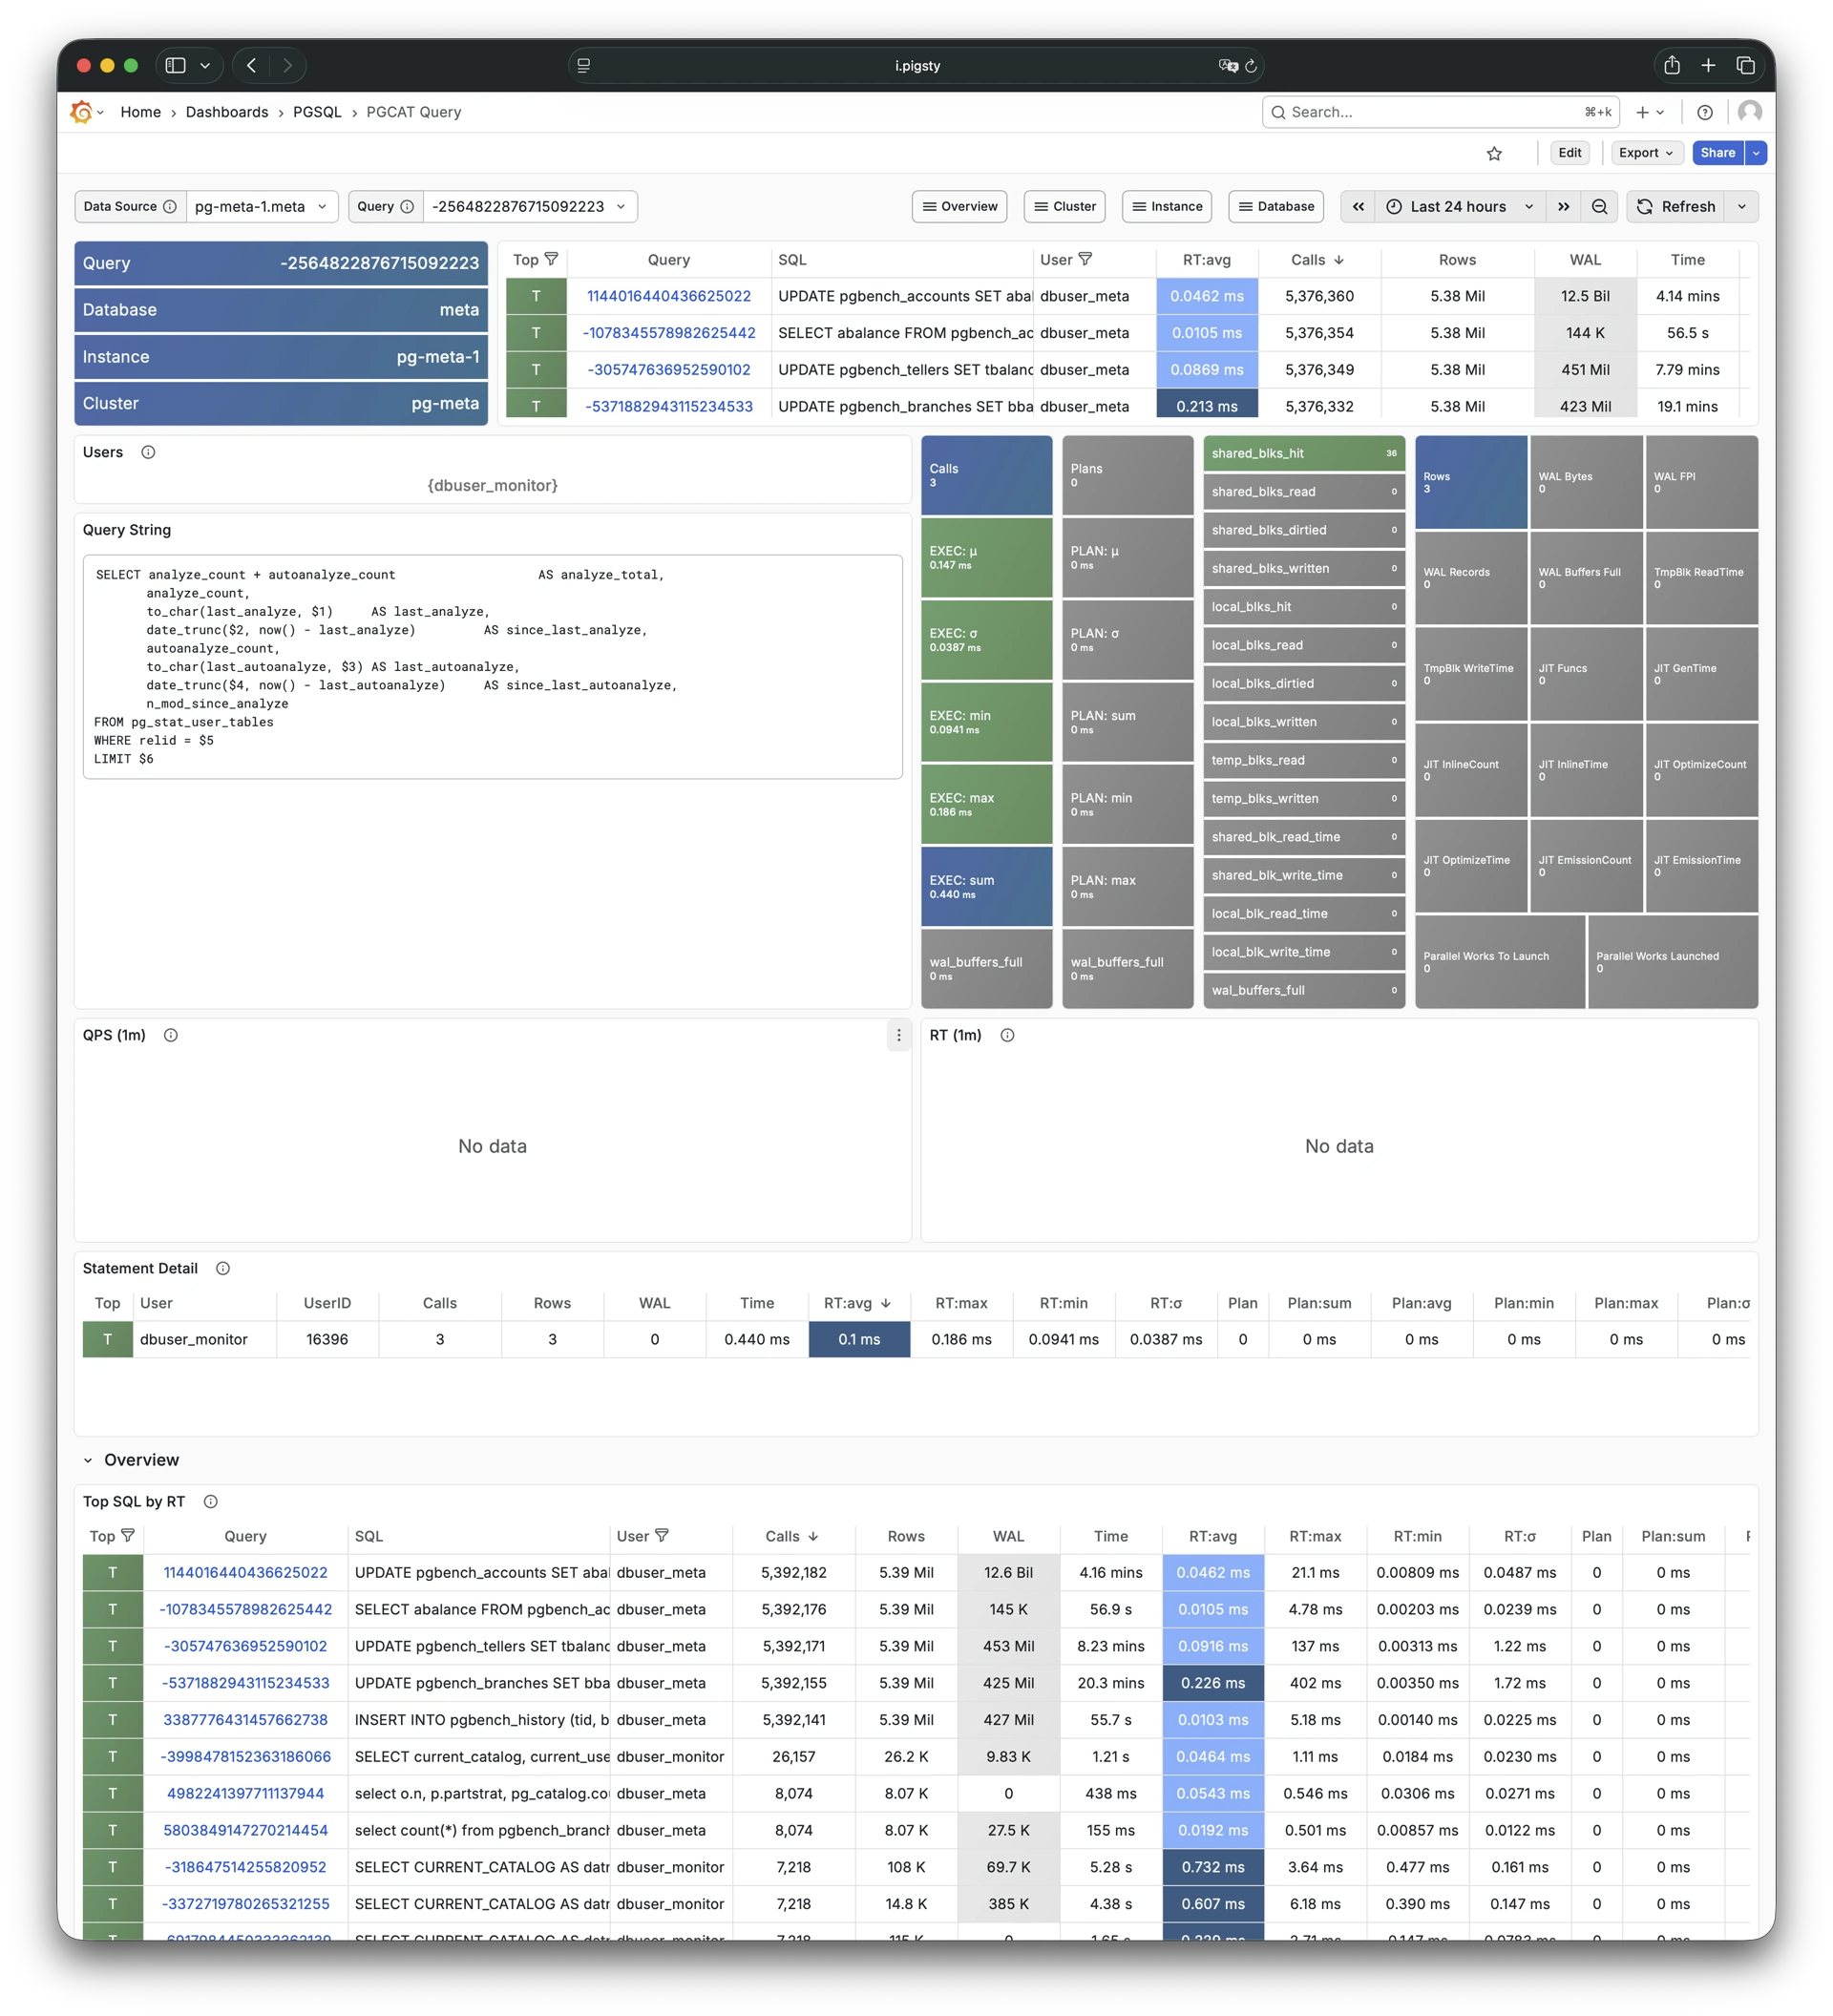
PGCAT Query shows query details from database catalog including SQL text and execution statistics.
4.8 - PGCAT Locks
Activity and lock wait info: Demo
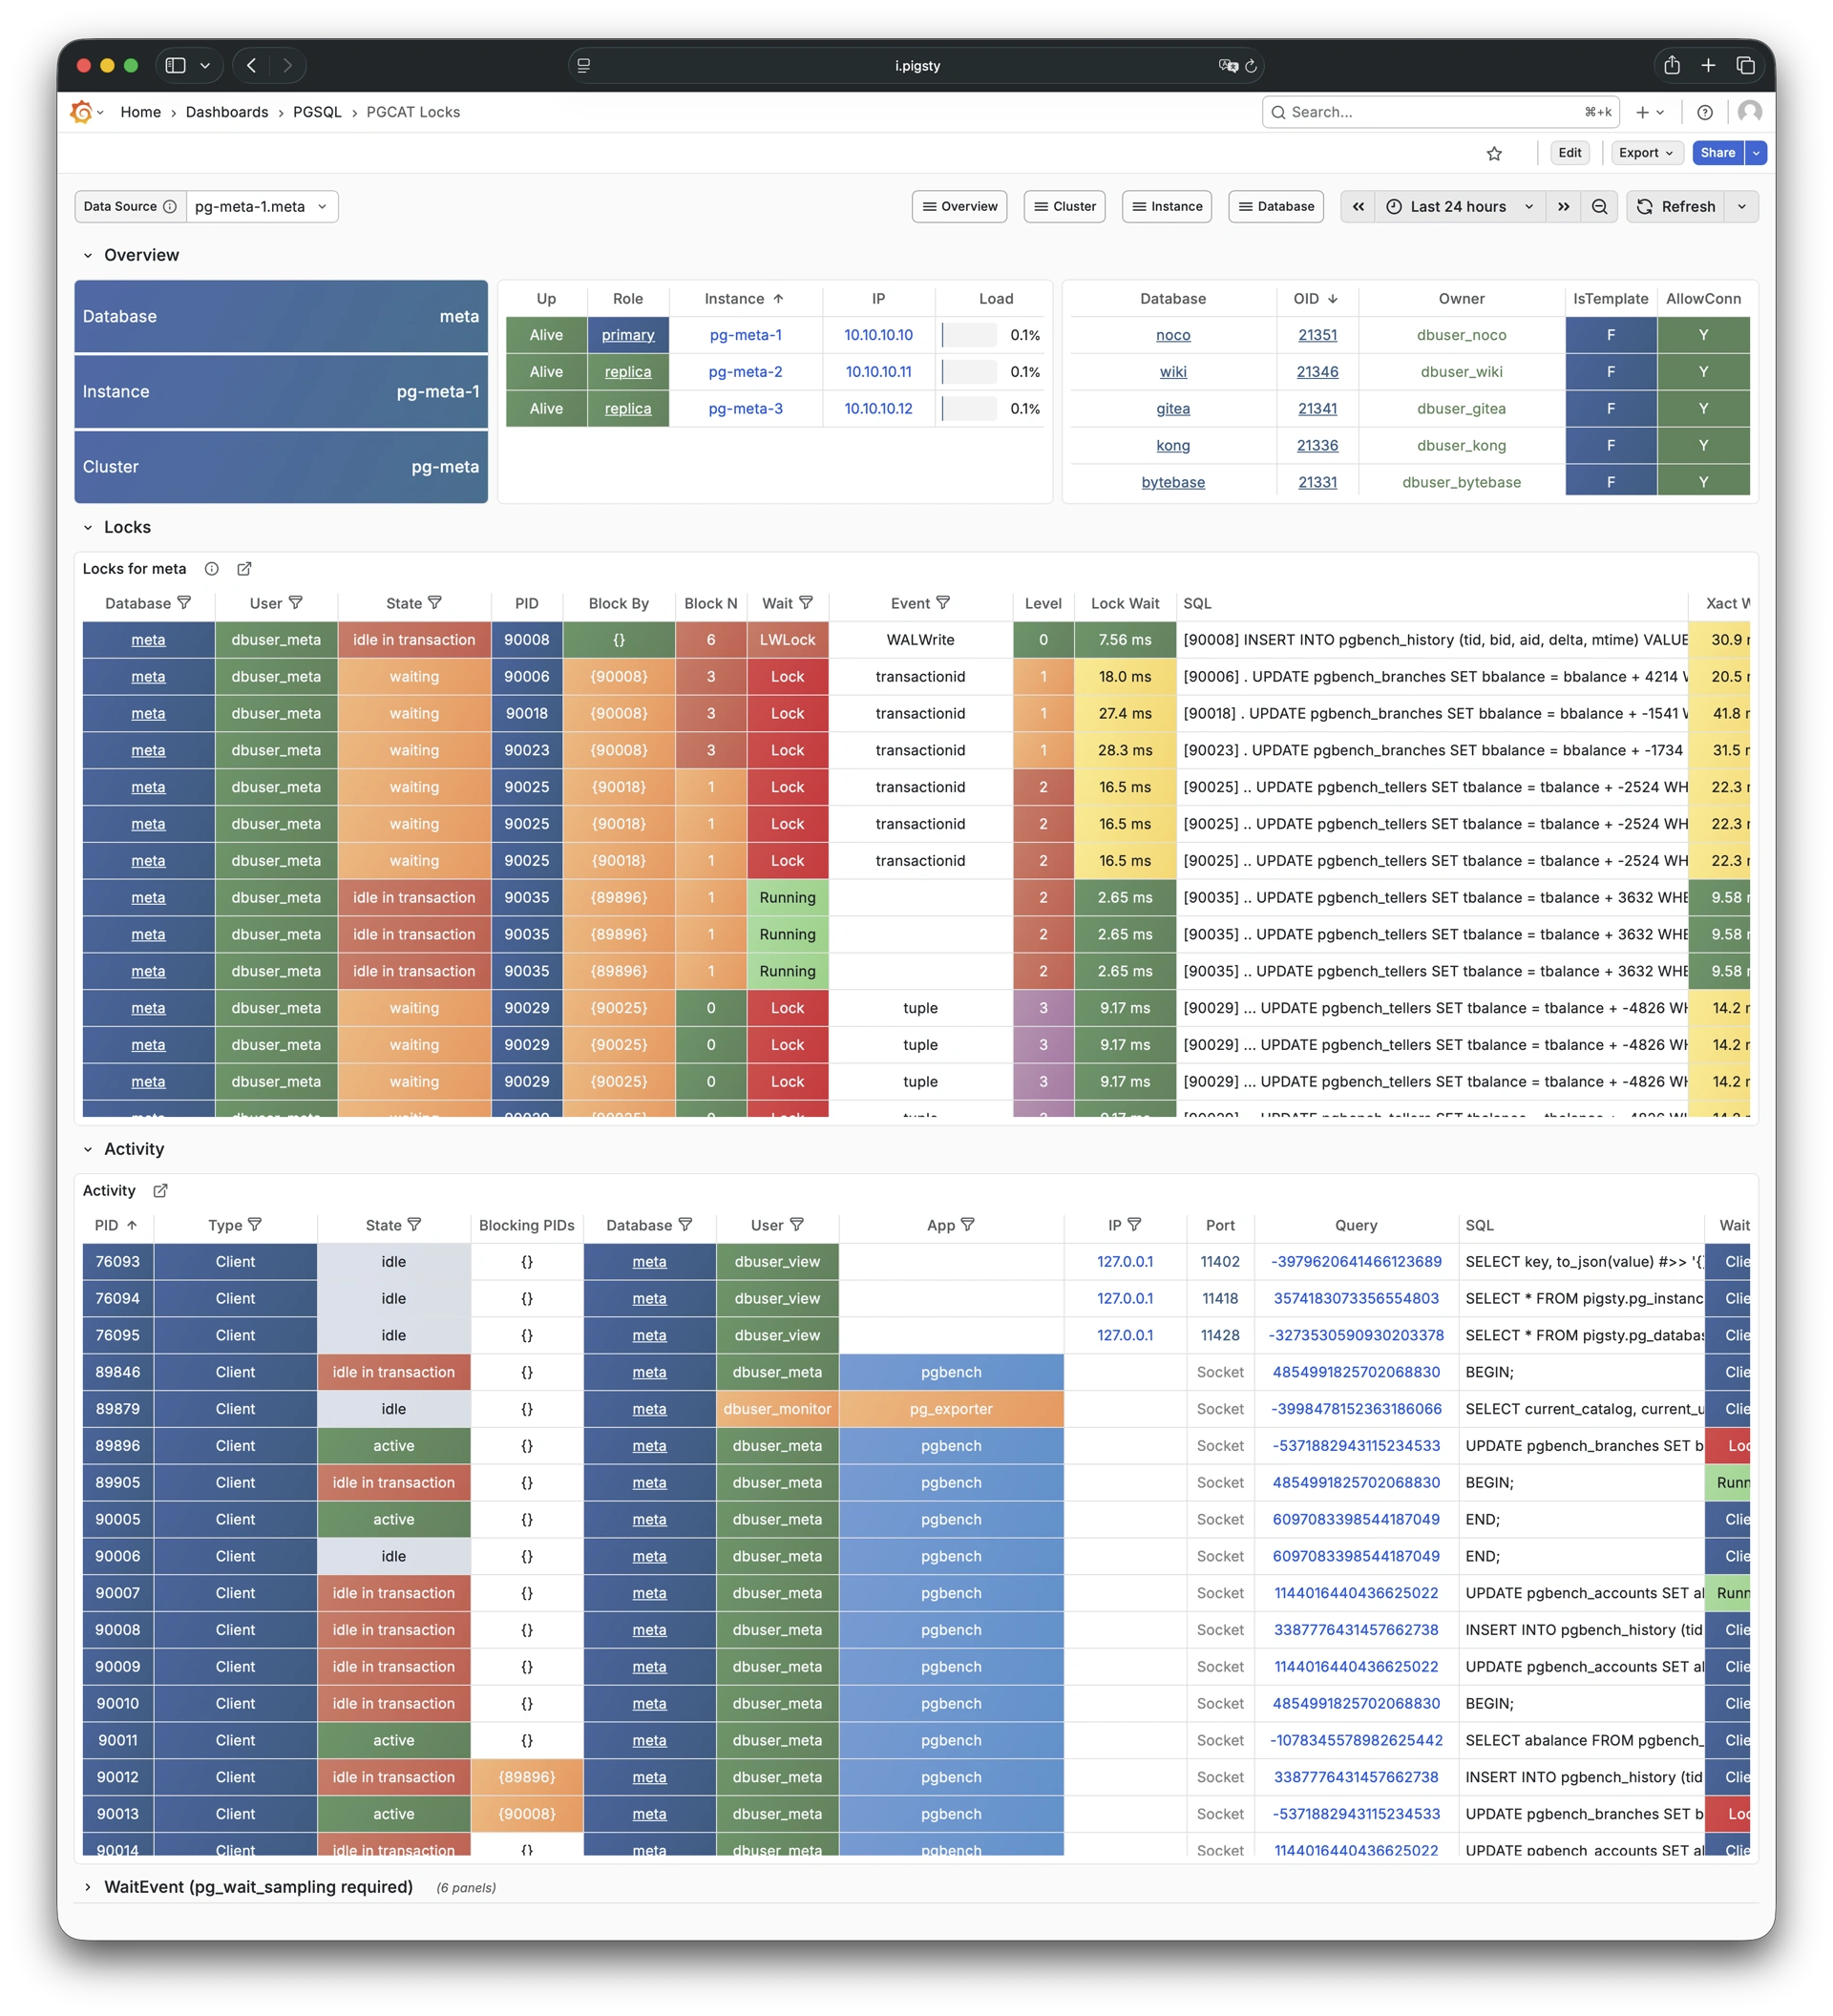
PGCAT Locks shows active sessions and lock wait information from database catalog.
4.9 - PGCAT Schema
Schema info from database catalog: Demo
PGCAT Schema shows schema-level information from database catalog including tables, indexes, and sequences.